

 Set up docs MCP
The following configuration options are available for each component of ClickStack:
Settings for open source distributions
Docker
If using the All in One, HyperDX Only or Local Mode simply pass the desired setting via an environment variable e.g.
docker run -e HYPERDX_LOG_LEVEL='debug' -p 8080:8080 -p 4317:4317 -p 4318:4318 clickhouse/clickstack-all-in-one:latestDocker Compose
If using the Docker Compose deployment guide, the .env file can be used to modify settings.
Alternatively, explicitly overwrite settings in the docker-compose.yaml file e.g.
Example:
services:
  app:
    environment:
      HYPERDX_API_KEY: ${HYPERDX_API_KEY}
      HYPERDX_LOG_LEVEL: ${HYPERDX_LOG_LEVEL}
      # ... other settings
Helm
Customizing values (optional)
You can customize settings by using --set flags e.g.
helm install my-hyperdx hyperdx/hdx-oss-v2 \
  --set replicaCount=2 \
  --set resources.limits.cpu=500m \
  --set resources.limits.memory=512Mi \
  --set resources.requests.cpu=250m \
  --set resources.requests.memory=256Mi \
  --set ingress.enabled=true \
  --set ingress.annotations."kubernetes\.io/ingress\.class"=nginx \
  --set ingress.hosts[0].host=hyperdx.example.com \
  --set ingress.hosts[0].paths[0].path=/ \
  --set ingress.hosts[0].paths[0].pathType=ImplementationSpecific \
  --set env[0].name=CLICKHOUSE_USER \
  --set env[0].value=abc
Alternatively edit the values.yaml. To retrieve the default values:
helm show values hyperdx/hdx-oss-v2 > values.yamlExample config:
replicaCount: 2
resources:
  limits:
    cpu: 500m
    memory: 512Mi
  requests:
    cpu: 250m
    memory: 256Mi
ingress:
  enabled: true
  annotations:
    kubernetes.io/ingress.class: nginx
  hosts:
    - host: hyperdx.example.com
      paths:
        - path: /
          pathType: ImplementationSpecific
  env:
    - name: CLICKHOUSE_USER
      value: abc
ClickStack UI (HyperDX) application
Data source settings
The ClickStack UI relies on the user defining a source for each of the Observability data types/pillars:
LogsTracesMetricsSessions
This configuration can be performed inside the application from Team Settings -> Sources, as shown below for logs:
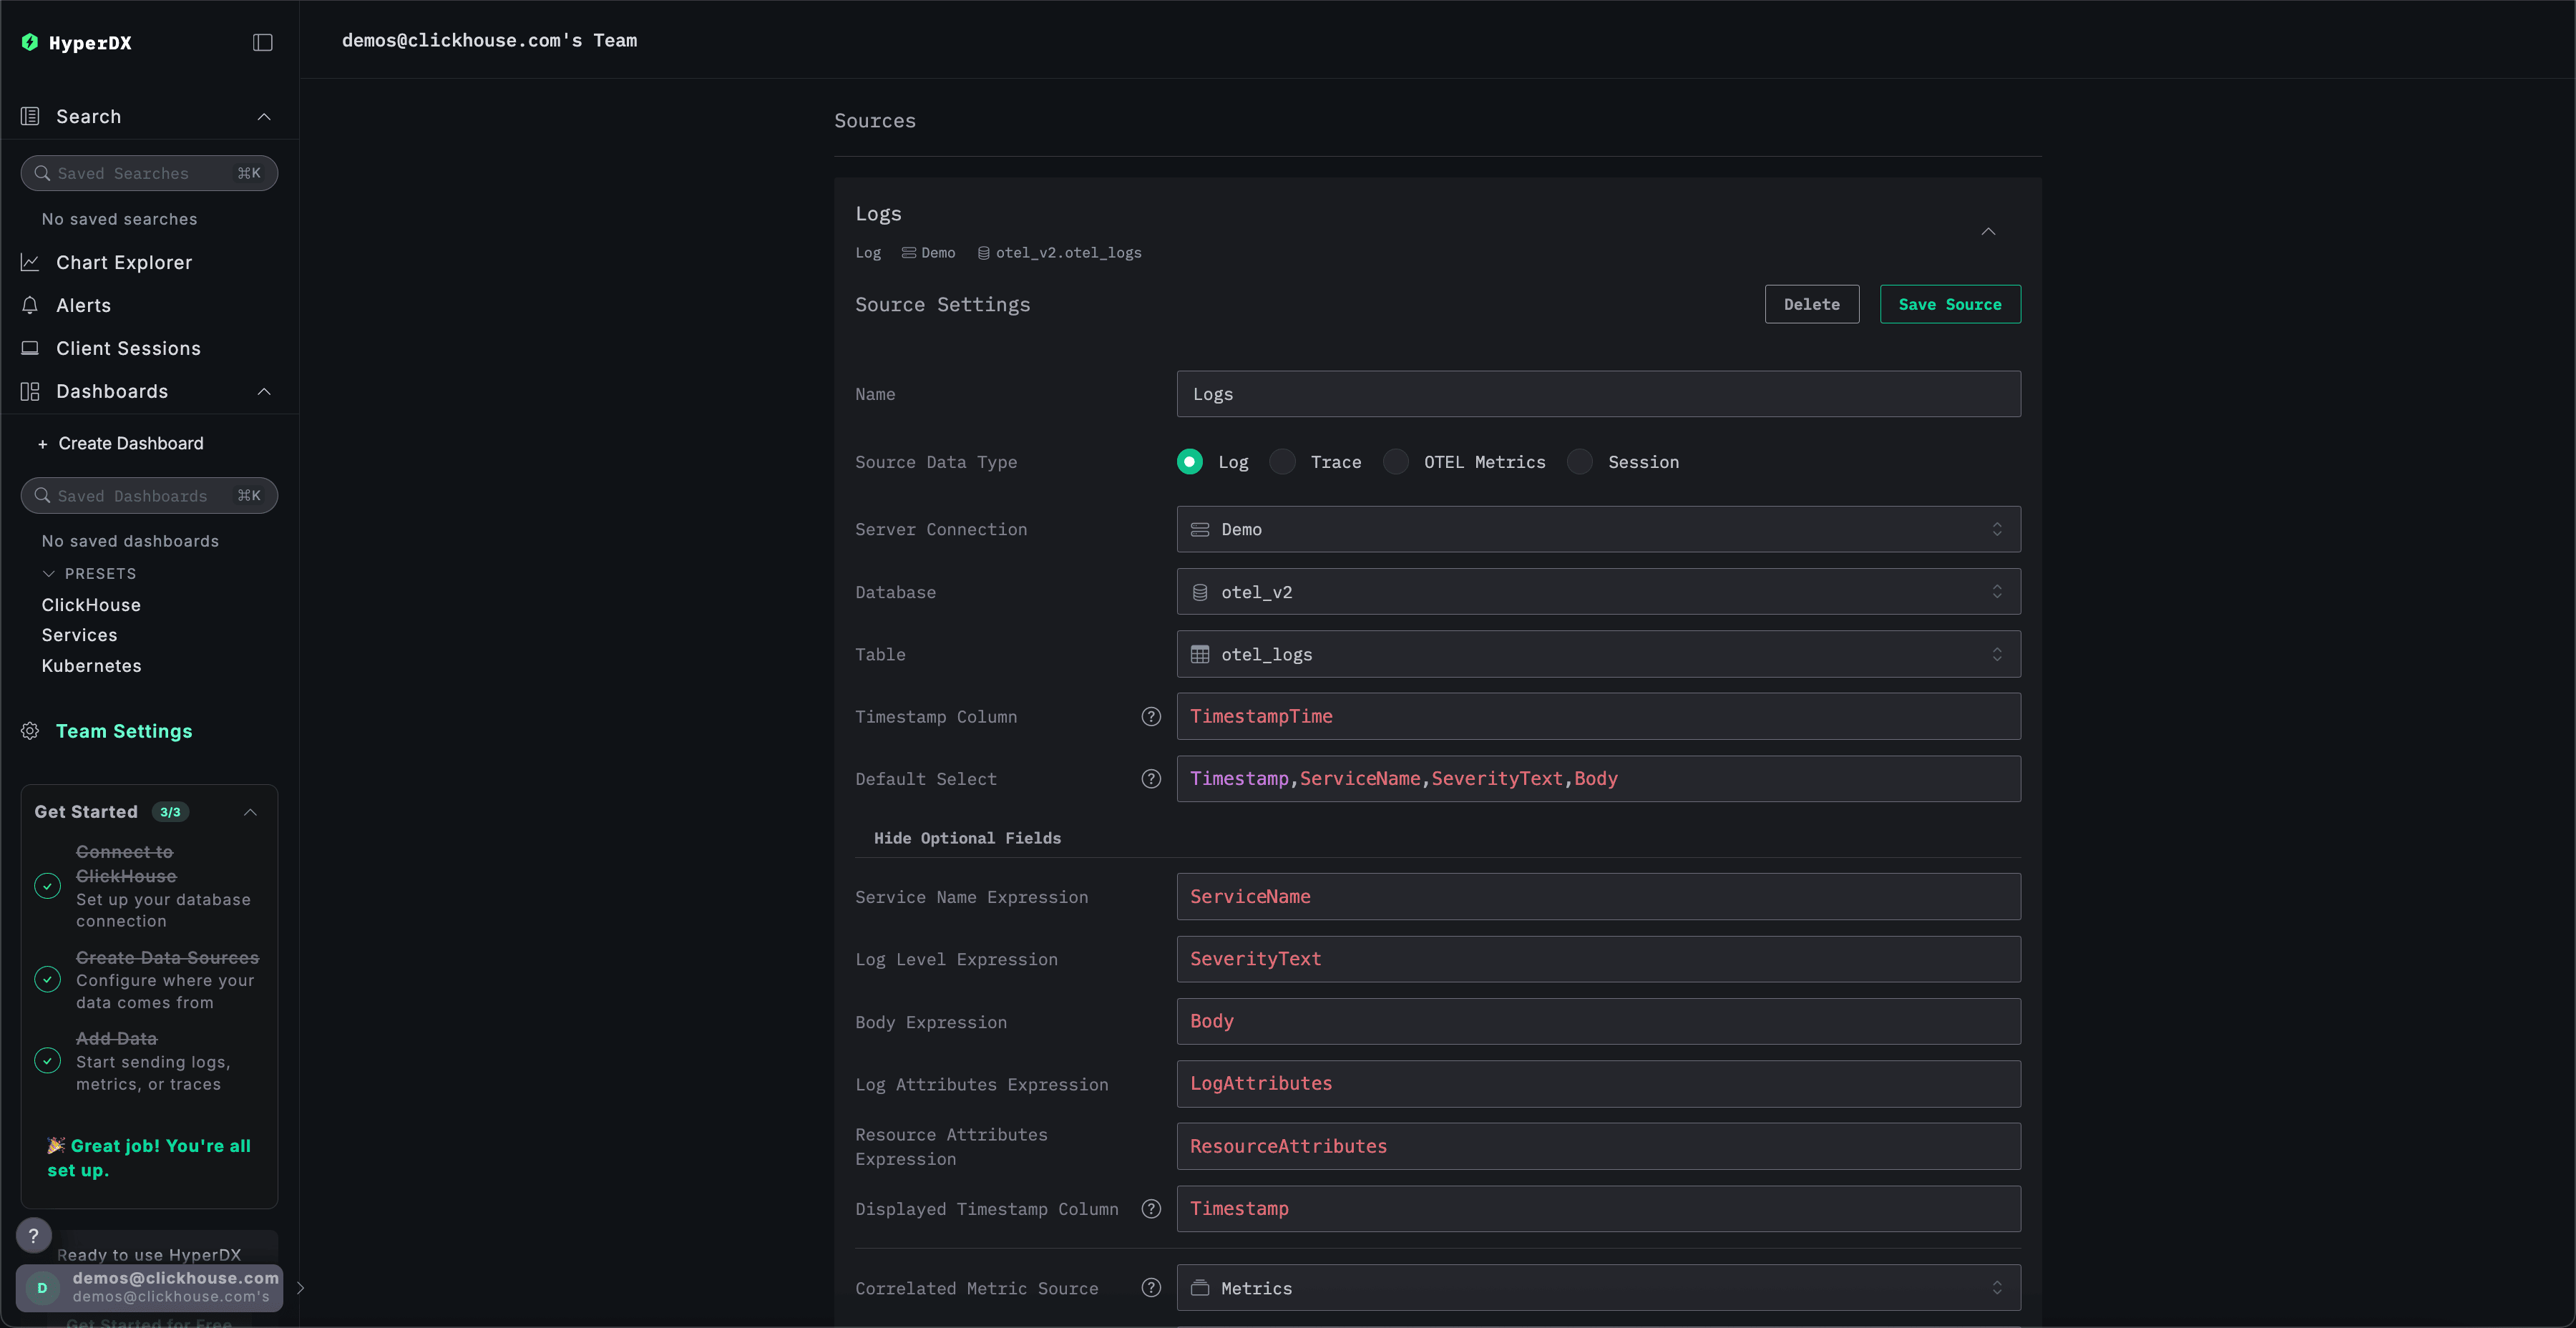
Each of these sources require at least one table specified on creation and a set of columns which allow HyperDX to query the data.
If using the default OpenTelemetry (OTel) schema distributed with ClickStack, these columns can be automatically inferred for each of the sources. If modifying the schema or using a custom schema, users are required to specify and update these mappings.
The following settings are available for each source:
Logs
| Setting | Description | Required | Inferred in Default Schema | Inferred Value |
|---|---|---|---|---|
Name |
Source name. | Yes | No | – |
Section |
Optional label for grouping sources in the source selector. Sources that share a section appear together, and search matches the section name in addition to the source name. | No | No | – |
Server Connection |
Server connection name. | Yes | No | Default |
Database |
ClickHouse database name. | Yes | Yes | default |
Table |
Target table name. Set to otel_logs if default schema is used. |
Yes | No | |
Query Settings |
Query-level session settings, each given as a setting name and a value, which are added to every query issued against this source. | No | No | – |
Enabled |
A disabled source is retained, but hidden from the source selectors and never chosen automatically. | No | No | Enabled |
Timestamp Column |
Datetime column or expression that’s part of your primary key. | Yes | Yes | TimestampTime |
Default Select |
Columns shown in default search results. | Yes | Yes | Timestamp, ServiceName, SeverityText, Body |
Service Name Expression |
Expression or column for the service name. | Yes | Yes | ServiceName |
Service Version Expression |
Expression or column identifying the running release of a service, used to draw release markers on dashboard charts. Defaults to the OpenTelemetry service.version resource attribute when left blank. |
No | No | ResourceAttributes['service.version'] |
Log Level Expression |
Expression or column for the log level. | Yes | Yes | SeverityText |
Body Expression |
Expression or column for the log message. | Yes | Yes | Body |
Log Attributes Expression |
Expression or column for custom log attributes. | Yes | Yes | LogAttributes |
Resource Attributes Expression |
Expression or column for resource-level attributes. | Yes | Yes | ResourceAttributes |
Displayed Timestamp Column |
Optional, higher-precision timestamp column used in UI display. Defaults to Timestamp Column when not provided. | No | Yes | Timestamp |
Correlated Metric Source |
Linked metric source (e.g. HyperDX metrics). | No | No | – |
Correlated Trace Source |
Linked trace source (e.g. HyperDX traces). | No | No | – |
Trace Id Expression |
Expression or column used to extract trace ID. | Yes | Yes | TraceId |
Span Id Expression |
Expression or column used to extract span ID. | Yes | Yes | SpanId |
Implicit Column Expression |
Column used for full-text search if no field is specified (Lucene-style). Typically the log body. | Yes | Yes | Body |
Known Columns List |
For sources over a Distributed or Merge table whose target tables have non-matching column sets. A comma-separated list of the columns available across all target tables, used instead of SELECT * when fetching full row data (for example, in the row side panel). Leave blank to select all columns. Column names only - no expressions or aliases. |
No | No | – |
Use Text Index |
Whether Lucene-based searches emit hasAllTokens when searching the implicit column. |
No | No | Auto (detect from schema) |
Highlighted Attributes |
Expressions or columns displayed when opening log details. Expressions returning URLs will be shown as links. | No | No | – |
Highlighted Trace Attributes |
Expressions or columns extracted from each log in a trace, displayed above the trace waterfall. Expressions returning URLs will be shown as links. | No | No | – |
Materialized Views |
Pre-aggregated materialized views registered against this source, used automatically to accelerate eligible queries. See Materialized views. | No | No | – |
Metadata Materialized Views |
Materialized views used to accelerate field discovery and value autocomplete. See Metadata materialized views. | No | Yes | <table>_kv_rollup_15m |
Default Order By |
ORDER BY expression which overrides the default ordering of search results. Leave empty to use the auto-detected default. This can be customized per search later. |
No | No | – |
Traces
| Setting | Description | Required | Inferred in Default Schema | Inferred Value |
|---|---|---|---|---|
Name |
Source name. | Yes | No | – |
Section |
Optional label for grouping sources in the source selector. Sources that share a section appear together, and search matches the section name in addition to the source name. | No | No | – |
Server Connection |
Server connection name. | Yes | No | Default |
Database |
ClickHouse database name. | Yes | Yes | default |
Table |
Target table name. Set to otel_traces if using the default schema. |
Yes | Yes | - |
Query Settings |
Query-level session settings, each given as a setting name and a value, which are added to every query issued against this source. | No | No | – |
Enabled |
A disabled source is retained, but hidden from the source selectors and never chosen automatically. | No | No | Enabled |
Timestamp Column |
Datetime column or expression that’s part of your primary key. | Yes | Yes | Timestamp |
Default Select |
Columns shown in default search results. | Yes | Yes | Timestamp, ServiceName as service, StatusCode as level, round(Duration / 1e6) as duration, SpanName |
Duration Expression |
Expression for calculating span duration. | Yes | Yes | Duration |
Duration Precision |
Precision for the duration expression (e.g. nanoseconds, microseconds). | Yes | Yes | ns |
Trace Id Expression |
Expression or column for trace IDs. | Yes | Yes | TraceId |
Span Id Expression |
Expression or column for span IDs. | Yes | Yes | SpanId |
Parent Span Id Expression |
Expression or column for parent span IDs. | Yes | Yes | ParentSpanId |
Span Name Expression |
Expression or column for span names. | Yes | Yes | SpanName |
Span Kind Expression |
Expression or column for span kind (e.g. client, server). | Yes | Yes | SpanKind |
Correlated Log Source |
Optional. Linked log source (e.g. HyperDX logs). | No | No | – |
Correlated Session Source |
Optional. Linked session source. | No | No | – |
Correlated Metric Source |
Optional. Linked metric source (e.g. HyperDX metrics). | No | No | – |
Status Code Expression |
Expression for the span status code. | Yes | Yes | StatusCode |
Status Message Expression |
Expression for the span status message. | Yes | Yes | StatusMessage |
Service Name Expression |
Expression or column for the service name. | Yes | Yes | ServiceName |
Service Version Expression |
Expression or column identifying the running release of a service, used to draw release markers on dashboard charts. Defaults to the OpenTelemetry service.version resource attribute when left blank. |
No | No | ResourceAttributes['service.version'] |
Resource Attributes Expression |
Expression or column for resource-level attributes. | Yes | Yes | ResourceAttributes |
Event Attributes Expression |
Expression or column for event attributes. | Yes | Yes | SpanAttributes |
Sample Rate Expression |
Column or expression holding the upstream sampling weight (1/N). When set, aggregations (count, avg, sum, quantile) are corrected for sampling. Percentiles then use quantileTDigestWeighted, which is an approximation, so exact values may differ slightly. Leave empty if spans aren’t sampled. |
No | No | – |
Span Events Expression |
Expression to extract span events. Typically a Nested type column. This allows rendering of exception stack traces with supported language SDKs. |
Yes | Yes | Events |
Span Links Expression |
Expression to extract span links, used to capture links from a span to spans in other traces. Expected to be of type Nested(TraceId String, SpanId String, TraceState String, Attributes Map(LowCardinality(String), String)). |
No | Yes | Links |
Implicit Column Expression |
Column used for full-text search if no field is specified (Lucene-style). Typically the log body. | Yes | Yes | SpanName |
Known Columns List |
For sources over a Distributed or Merge table whose target tables have non-matching column sets. A comma-separated list of the columns available across all target tables, used instead of SELECT * when fetching full row data (for example, in the row side panel). Leave blank to select all columns. Column names only - no expressions or aliases. |
No | No | – |
Use Text Index |
Whether Lucene-based searches emit hasAllTokens when searching the implicit column. |
No | No | Auto (detect from schema) |
Displayed Timestamp Column |
Optional, higher-precision timestamp column used in UI display. Defaults to Timestamp Column when not provided. | No | Yes | Timestamp |
Highlighted Attributes |
Expressions or columns displayed when opening span details. Expressions returning URLs will be shown as links. | No | No | – |
Highlighted Trace Attributes |
Expressions or columns extracted from each span in a trace, displayed above the trace waterfall. Expressions returning URLs will be shown as links. | No | No | – |
Materialized Views |
Pre-aggregated materialized views registered against this source, used automatically to accelerate eligible queries. See Materialized views. | No | No | – |
Metadata Materialized Views |
Materialized views used to accelerate field discovery and value autocomplete. See Metadata materialized views. | No | Yes | <table>_kv_rollup_15m |
Default Order By |
ORDER BY expression which overrides the default ordering of search results. Leave empty to use the auto-detected default. This can be customized per search later. |
No | No | – |
Metrics
| Setting | Description | Required | Inferred in Default Schema | Inferred Value |
|---|---|---|---|---|
Name |
Source name. | Yes | No | – |
Section |
Optional label for grouping sources in the source selector. Sources that share a section appear together, and search matches the section name in addition to the source name. | No | No | – |
Server Connection |
Server connection name. | Yes | No | Default |
Database |
ClickHouse database name. | Yes | Yes | default |
Query Settings |
Up to ten query-level session settings, each given as a setting name and a value, which are added to every query issued against this source. | No | No | – |
Enabled |
Toggle at the top of the source form. A disabled source is retained, but hidden from the source selectors and never chosen automatically. Only shown when editing an existing source. | No | No | Enabled |
Gauge Table |
Table storing gauge-type metrics. | No | Yes | otel_metrics_gauge |
Histogram Table |
Table storing histogram-type metrics. | No | Yes | otel_metrics_histogram |
Sum Table |
Table storing sum-type (counter) metrics. | No | Yes | otel_metrics_sum |
Exponential Histogram Table |
Table storing exponential histogram-type metrics. | No | Yes | otel_metrics_exponential_histogram |
Correlated Log Source |
Optional. Linked log source (e.g. HyperDX logs). | No | No | – |
Sessions
| Setting | Description | Required | Inferred in Default Schema | Inferred Value |
|---|---|---|---|---|
Name |
Source name. | Yes | No | – |
Section |
Optional label for grouping sources in the source selector. Sources that share a section appear together, and search matches the section name in addition to the source name. | No | No | – |
Server Connection |
Server connection name. | Yes | No | Default |
Database |
ClickHouse database name. | Yes | Yes | default |
Table |
Target table for session data. Target table name. Set to hyperdx_sessions if using the default schema. |
Yes | Yes | - |
Query Settings |
Up to ten query-level session settings, each given as a setting name and a value, which are added to every query issued against this source. | No | No | – |
Enabled |
Toggle at the top of the source form. A disabled source is retained, but hidden from the source selectors and never chosen automatically. Only shown when editing an existing source. | No | No | Enabled |
Correlated Trace Source |
Linked trace source for session correlation. | Yes | No | – |
Timestamp Column |
Datetime column or expression that’s part of your primary key. | Yes | Yes | TimestampTime |
Resource Attributes Expression |
Expression for extracting resource-level metadata. | No | Yes | ResourceAttributes |
Materialized views
Materialized views can be registered against Log and Trace data sources so that eligible aggregation queries are answered from the pre-aggregated view instead of the source table. For guidance on creating and registering views, see “Materialized views”.
Each registered view is configured with the following settings:
| Setting | Description |
|---|---|
Database |
ClickHouse database containing the target table of the materialized view. |
Table |
Target table of the materialized view - not the view itself. |
Timestamp Column |
The timestamp column of the target table. |
Granularity |
The time bucket of the target table’s timestamp column, for example 1 minute. A query can only use the view if its own time bucket is equal to or coarser than this. |
Minimum Date |
Optional. The earliest date and time for which the view contains data. If not provided, ClickStack assumes the view contains data for every date the source table does. |
Dimension Columns |
Comma-separated list of the columns which aren’t pre-aggregated by the view, and can therefore be used for filtering and grouping. |
Pre-aggregated Columns |
The columns which are pre-aggregated by the view. Each entry maps an aggregate function (avg, count, max, min, quantile, sum or histogram) and a source table column to the corresponding column in the view. The source column isn’t required for count. |
Most of these settings are inferred from the view’s schema when the target table is selected.
Metadata materialized views
Metadata materialized views are materialized views which accelerate field discovery for filters and autocomplete. They can be configured on Log and Trace data sources.
| Setting | Description |
|---|---|
Key Rollup Table |
Optional and deprecated. Rollup table of the keys present in the source table. |
KV Rollup Table |
Rollup table of the key/value pairs present in the source table. |
Granularity |
The time bucket used by the rollup tables, for example 15 minute. |
Highlighted Attributes
Highlighted Attributes and Highlighted Trace Attributes can be configured on Log and Trace data sources.
- Highlighted Attributes are columns or expressions which are displayed for each log or span, when viewing log or span details.
- Highlighted Trace Attributes are columns or expressions which are queried from each log or span in a trace, and displayed above the trace waterfall.
These attributes are defined in the source configuration and can be arbitrary SQL expressions. If the SQL expression returns a value that is in the format of a URL, then the attribute will be displayed as a link. Empty values aren’t displayed.
Each attribute is configured with the following settings:
| Setting | Description |
|---|---|
SQL Expression |
The column or arbitrary SQL expression to query. Required. |
Alias |
Optional. The label displayed for the attribute in place of the SQL expression. |
Lucene Expression |
Optional. A Lucene version of the SQL expression, used when searching for this attribute value. |
For example, this trace source has been configured with a Highlighted Attribute and a Highlighted Trace Attribute:
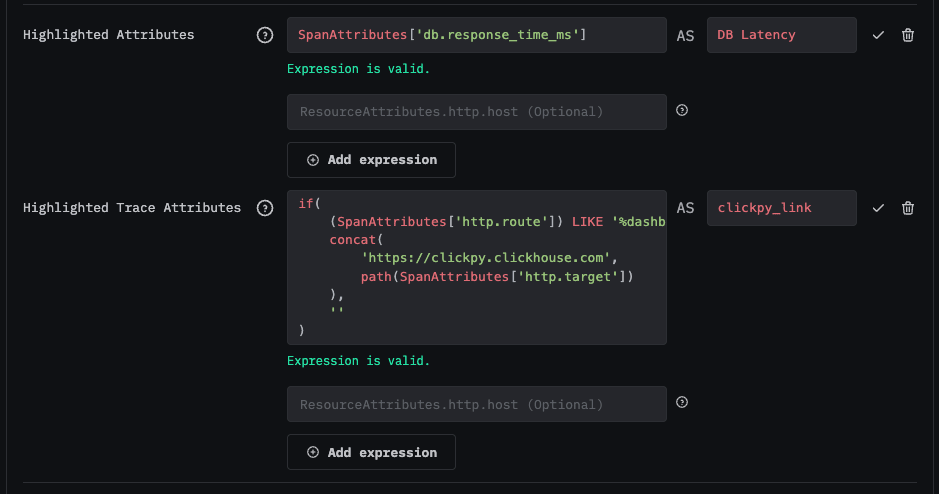
These attributes are displayed in the side panel after clicking on a log or span:
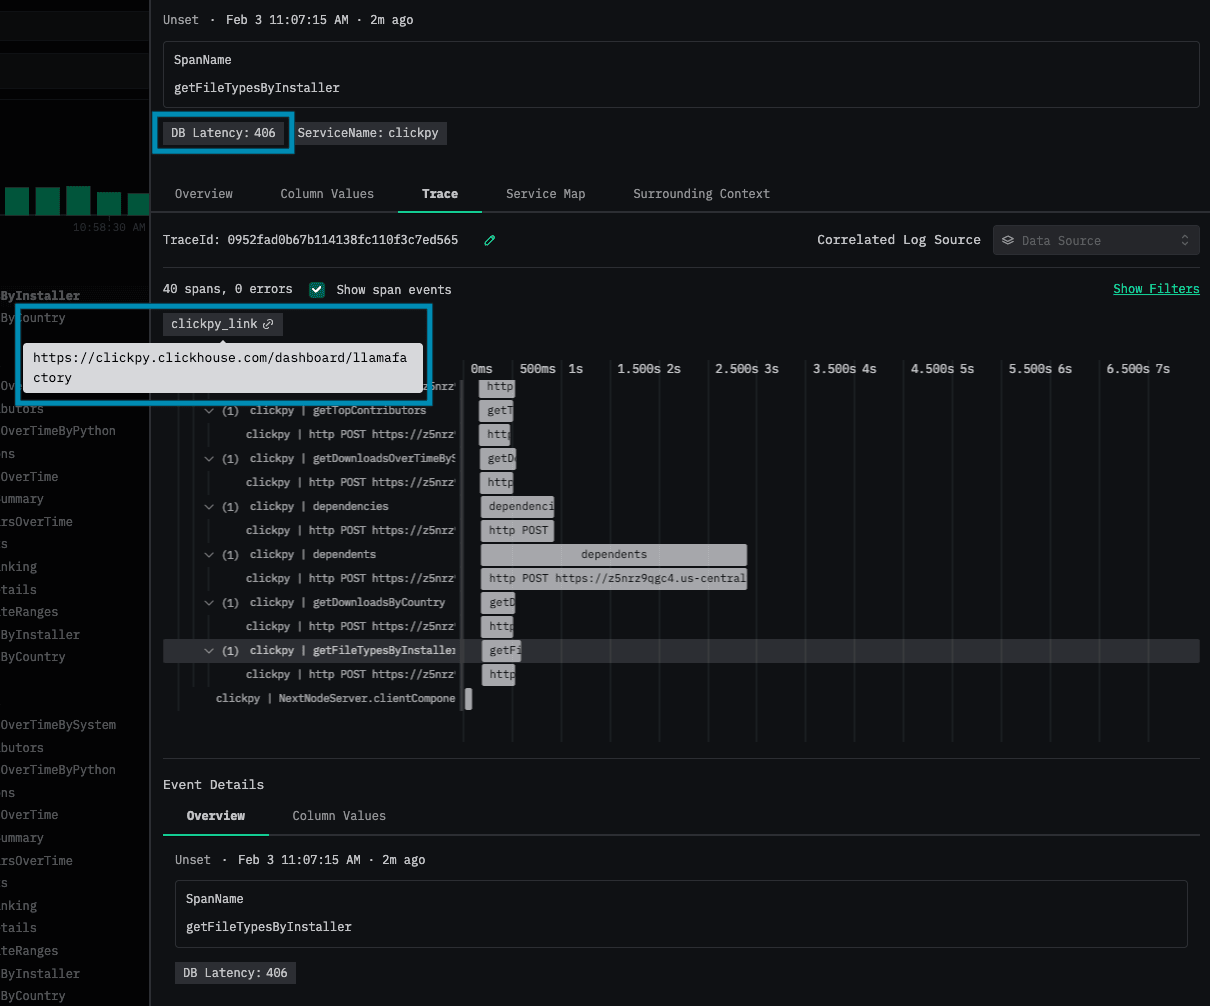
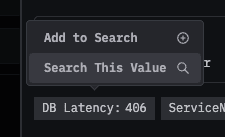
Clicking on an attribute provides options for using the attribute as a search value. If the optional Lucene expression is provided in the attribute configuration, then the Lucene expression will be used for the search instead of the SQL expression.
Correlated sources
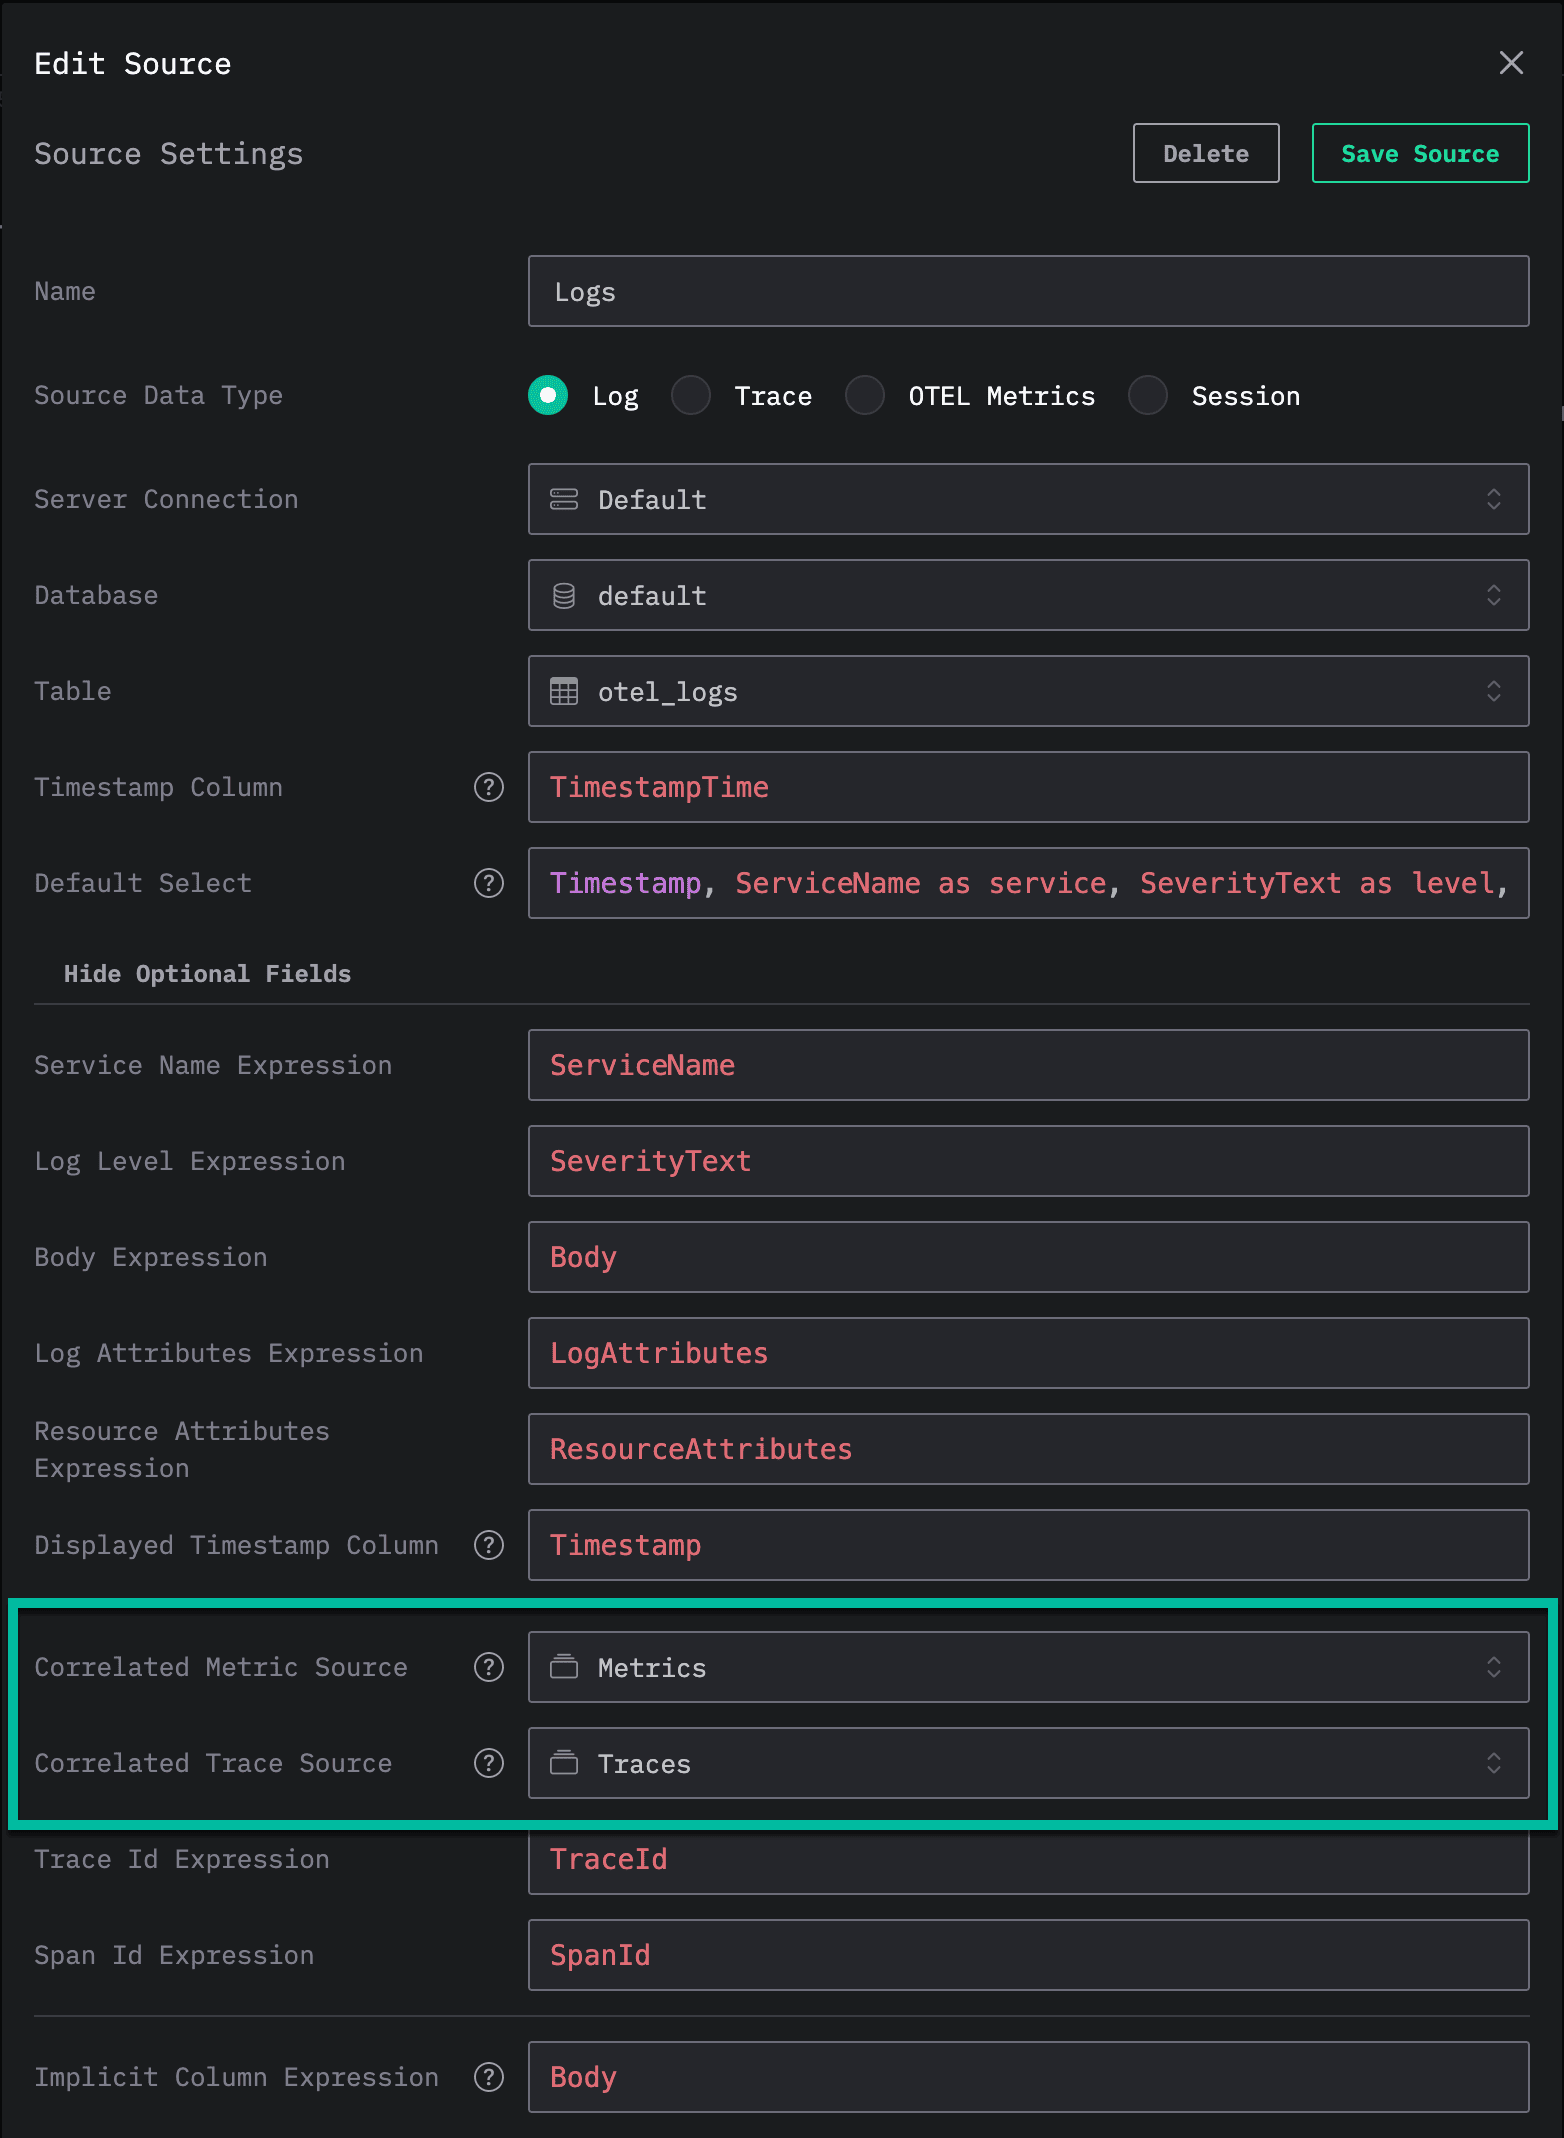
To enable full cross-source correlation in ClickStack, you must configure correlated sources for logs, traces, metrics, and sessions. This allows HyperDX to associate related data and provide rich context when rendering events.
Logs: Can be correlated with traces and metrics.Traces: Can be correlated with logs, sessions, and metrics.Metrics: Can be correlated with logs.Sessions: Can be correlated with traces.
Setting these correlations enables several features. For example, HyperDX can render relevant logs alongside a trace or surface metric anomalies linked to a session.
For example, below is the Logs source configured with correlated sources:
Application configuration settings
-
HYPERDX_API_KEY- Default: None (required)
- Description: Authentication key for the HyperDX API.
- Guidance:
- Required for telemetry and logging
- In local development, can be any non-empty value
- For production, use a secure, unique key
- Can be obtained from the team settings page after account creation
-
HYPERDX_LOG_LEVEL- Default:
info - Description: Sets the logging verbosity level.
- Options:
debug,info,warn,error - Guidance:
- Use
debugfor detailed troubleshooting - Use
infofor normal operation - Use
warnorerrorin production to reduce log volume
- Default:
-
HYPERDX_API_PORT- Default:
8000 - Description: Port for the HyperDX API server.
- Guidance:
- Ensure this port is available on your host
- Change if you have port conflicts
- Must match the port in your API client configurations
- Default:
-
HYPERDX_APP_PORT- Default:
8000 - Description: Port for the HyperDX frontend app.
- Guidance:
- Ensure this port is available on your host
- Change if you have port conflicts
- Must be accessible from your browser
- Default:
-
HYPERDX_APP_URL- Default:
http://localhost - Description: Base URL for the frontend app.
- Guidance:
- Set to your domain in production
- Include protocol (http/https)
- Don’t include trailing slash
- Default:
-
MONGO_URI- Default:
mongodb://db:27017/hyperdx - Description: MongoDB connection string.
- Guidance:
- Use default for local development with Docker
- For production, use a secure connection string
- Include authentication if required
- Example:
mongodb://user:pass@host:port/db
- Default:
-
MINER_API_URL- Default:
http://miner:5123 - Description: URL for the log pattern mining service.
- Guidance:
- Use default for local development with Docker
- Set to your miner service URL in production
- Must be accessible from the API service
- Default:
-
FRONTEND_URL- Default:
http://localhost:3000 - Description: URL for the frontend app.
- Guidance:
- Use default for local development
- Set to your domain in production
- Must be accessible from the API service
- Default:
-
OTEL_SERVICE_NAME- Default:
hdx-oss-api - Description: Service name for OpenTelemetry instrumentation.
- Guidance:
- Use descriptive name for your HyperDX service. Applicable if HyperDX self-instruments.
- Helps identify the HyperDX service in telemetry data
- Default:
-
NEXT_PUBLIC_OTEL_EXPORTER_OTLP_ENDPOINT- Default:
http://localhost:4318 - Description: OpenTelemetry collector endpoint.
- Guidance:
- Relevant of self-instrumenting HyperDX.
- Use default for local development
- Set to your collector URL in production
- Must be accessible from your HyperDX service
- Default:
-
USAGE_STATS_ENABLED- Default:
true - Description: Toggles usage statistics collection.
- Guidance:
- Set to
falseto disable usage tracking - Useful for privacy-sensitive deployments
- Default is
truefor better product improvement
- Default:
-
IS_OSS- Default:
true - Description: Indicates if running in OSS mode.
- Guidance:
- Keep as
truefor open-source deployments - Set to
falsefor enterprise deployments - Affects feature availability
- Default:
-
IS_LOCAL_MODE- Default:
false - Description: Indicates if running in local mode.
- Guidance:
- Set to
truefor local development - Disables certain production features
- Useful for testing and development
- Default:
-
EXPRESS_SESSION_SECRET- Default:
hyperdx is cool 👋 - Description: Secret for Express session management.
- Guidance:
- Change in production
- Use a strong, random string
- Keep secret and secure
- Default:
-
ENABLE_SWAGGER- Default:
false - Description: Toggles Swagger API documentation.
- Guidance:
- Set to
trueto enable API documentation - Useful for development and testing
- Disable in production
- Default:
-
BETA_CH_OTEL_JSON_SCHEMA_ENABLED- Default:
false - Description: Enables Beta support for the JSON type in HyperDX. See also
OTEL_AGENT_FEATURE_GATE_ARGto enable JSON support in the OTel collector. - Guidance:
- Enables a beta feature. JSON-typed schemas are not recommended for typical observability workloads. See Map vs JSON type for the comparison and when each is appropriate.
- Set to
trueto enable JSON support in the ClickStack UI.
- Default:
OpenTelemetry collector
See “ClickStack OpenTelemetry Collector” for more details.
-
CLICKHOUSE_ENDPOINT- Default: None (required) if standalone image. If All-in-one or Docker Compose distribution this is set to the integrated ClickHouse instance.
- Description: The HTTPS URL of the ClickHouse instance to export telemetry data to.
- Guidance:
- Must be a full HTTPS endpoint including port (e.g.,
https://clickhouse.example.com:8443) - Required for the collector to send data to ClickHouse
- Must be a full HTTPS endpoint including port (e.g.,
-
CLICKHOUSE_USER- Default:
default - Description: Username used to authenticate with the ClickHouse instance.
- Guidance:
- Ensure the user has
INSERTandCREATE TABLEpermissions - Recommended to create a dedicated user for ingestion
- Ensure the user has
- Default:
-
CLICKHOUSE_PASSWORD- Default: None (required if authentication is enabled)
- Description: Password for the specified ClickHouse user.
- Guidance:
- Required if the user account has a password set
- Store securely via secrets in production deployments
-
HYPERDX_LOG_LEVEL- Default:
info - Description: Log verbosity level for the collector.
- Guidance:
- Accepts values like
debug,info,warn,error - Use
debugduring troubleshooting
- Accepts values like
- Default:
-
OPAMP_SERVER_URL- Default: None (required) if standalone image. If All-in-one or Docker Compose distribution this points to the deployed HyperDX instance.
- Description: URL of the OpAMP server used to manage the collector (e.g., HyperDX instance). This is port
4320by default. - Guidance:
- Must point to your HyperDX instance
- Enables dynamic configuration and secure ingestion
- If omitted, secure ingestion is disabled unless an
OTLP_AUTH_TOKENvalue is specified.
-
OTLP_AUTH_TOKEN- Default: None. Used only for standalone image.
- Description: Allows an OTLP authentication token to be specified. If set, all communication requires this bearer token.
- Guidance:
- Recommended if using the standalone collector image in production.
-
HYPERDX_OTEL_EXPORTER_CLICKHOUSE_DATABASE- Default:
default - Description: ClickHouse database the collector writes telemetry data to.
- Guidance:
- Set if using a custom database name
- Ensure the specified user has access to this database
- Default:
-
OTEL_AGENT_FEATURE_GATE_ARG- Default:
<empty string> - Description: Enables feature flags in the collector. If set to
--feature-gates=clickhouse.json, enables Beta support for the JSON type in the collector, ensuring schemas are created with that type. See alsoBETA_CH_OTEL_JSON_SCHEMA_ENABLEDto enable JSON support in HyperDX. - Guidance:
- Enables a beta feature. JSON-typed schemas are not recommended for typical observability workloads. See Map vs JSON type for the comparison and when each is appropriate.
- Set to
--feature-gates=clickhouse.jsonto create new tables using the JSON type.
- Default:
ClickHouse
ClickStack Open Source ships with a default ClickHouse configuration designed for multi-terabyte scale, but users are free to modify and optimize it to suit their workload.
To tune ClickHouse effectively, you should understand key storage concepts such as parts, partitions, shards and replicas, and how merges occur at insert time. We recommend reviewing the fundamentals of primary indices, sparse secondary indices, and data skipping indices, along with techniques for managing data lifecycle e.g. using a TTL lifecycle.
ClickStack supports schema customization - you may modify column types, extract new fields (e.g. from logs), apply codecs and dictionaries, and accelerate queries using projections.
Additionally, materialized views can be used to transform or filter data during ingestion, provided that data is written to the source table of the view and the application reads from the target table. Materialized views can also be used to accelerate queries natively in ClickStack.
For more details, refer to ClickHouse documentation on schema design, indexing strategies, and data management best practices - most of which apply directly to ClickStack deployments.