

 Set up docs MCP
Deploy Managed ClickStack on ClickHouse Cloud, send a test event through your ingestion pipeline, and confirm that the event is available in the ClickStack UI.
ClickHouse Cloud operates the ClickHouse backend while you retain control over the ingestion pipeline and schema. Managed ClickStack provides:
- Automatic scaling of compute, independent of storage
- Low-cost and effectively unlimited retention based on object storage
- Independent isolation of read and write workloads with warehouses
- Integrated authentication
- Automated backups
- Security and compliance features
- Seamless upgrades
Before you begin
You can also send data directly to ClickHouse using a supported integration and your own schema.
Create a ClickHouse Cloud service
Complete Create a ClickHouse service in the ClickHouse Cloud quickstart. Before continuing, confirm that the service is running.
Prepare your ingestion environment
- To start a new OpenTelemetry Collector, install Docker. For Kubernetes, deploy the collector with Helm.
- To use an existing collector, run it in the gateway role and ensure that its distribution includes the ClickHouse exporter. You will add the required configuration in this guide.
Set up Managed ClickStack
Choose an ingestion source and collector setup
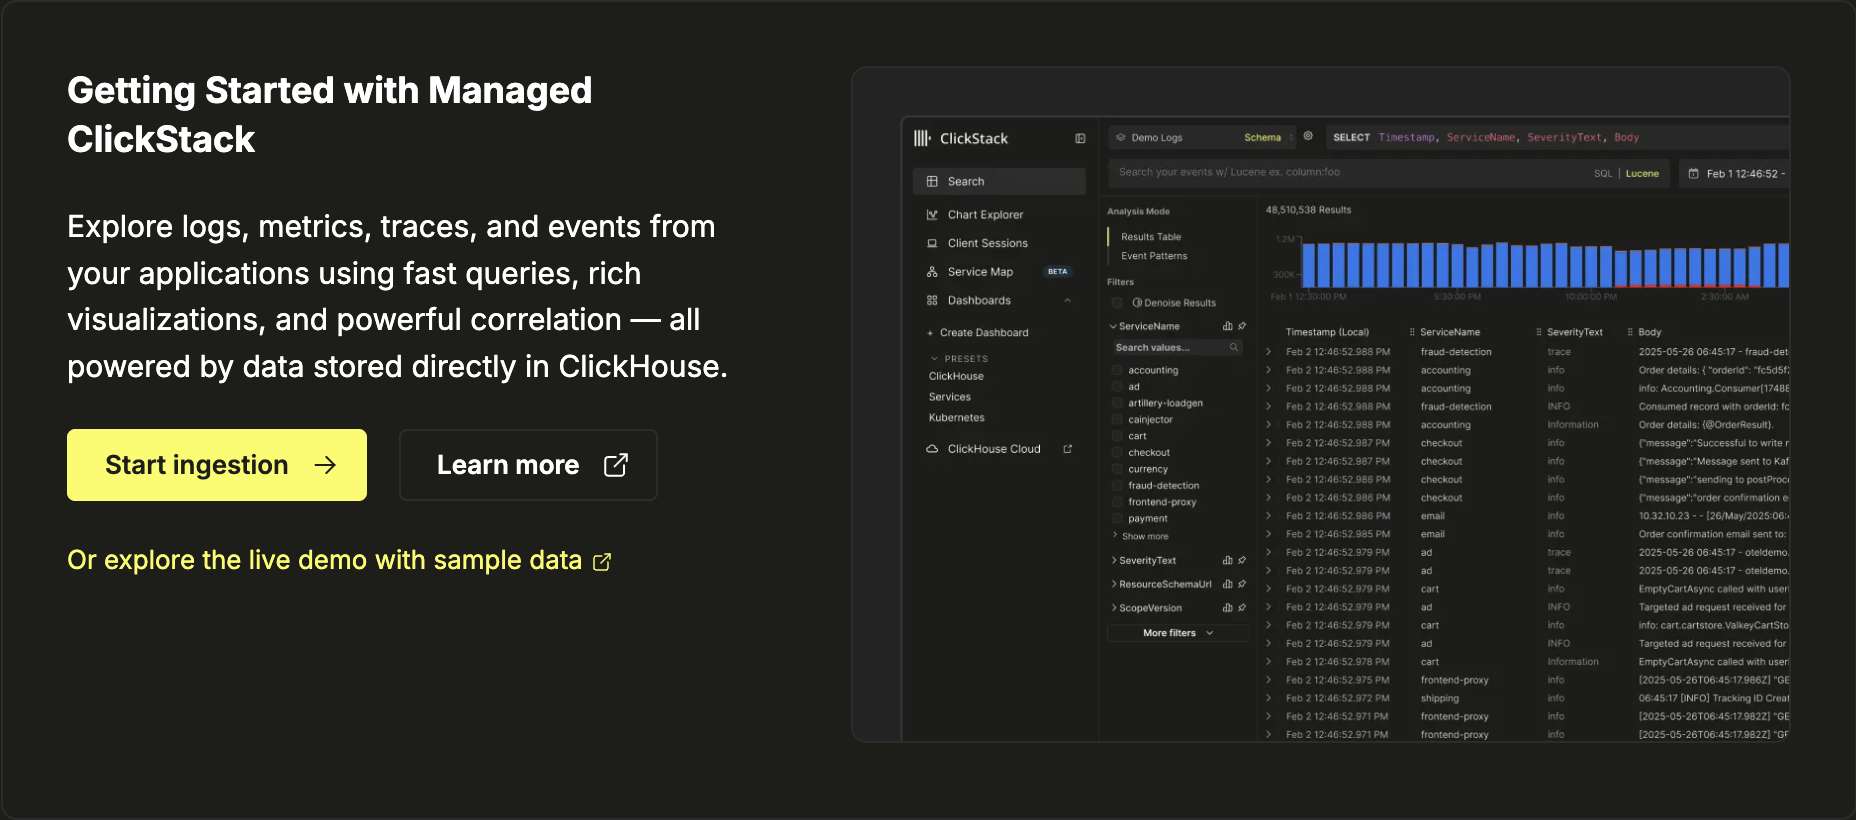
From your ClickHouse Cloud service, launch ClickStack. On the ClickStack Getting Started page, select Start ingestion.
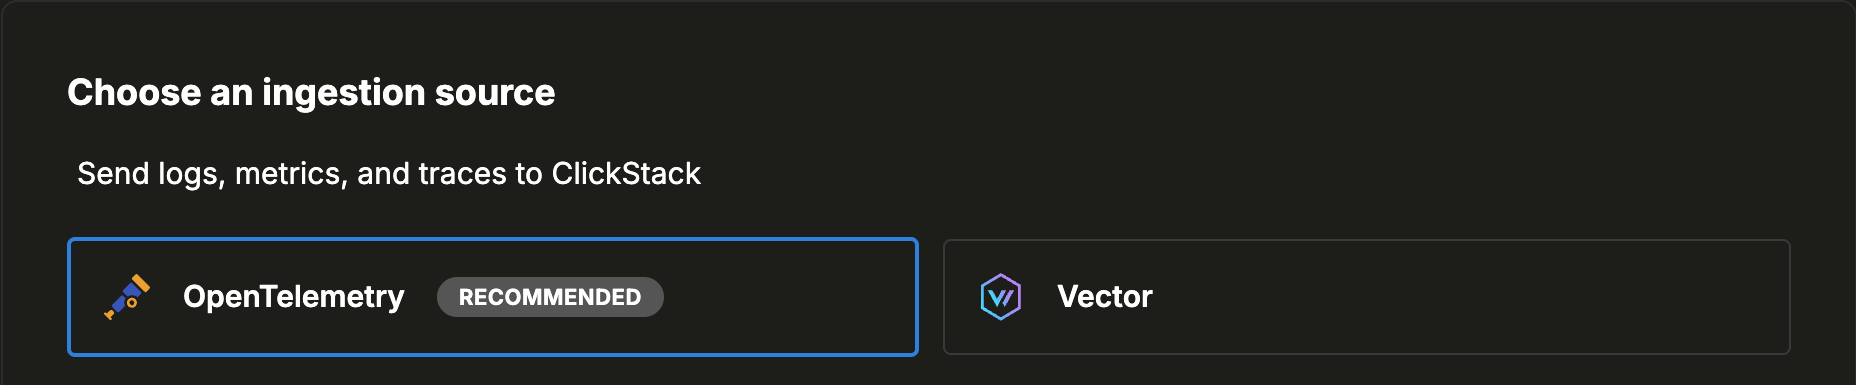
On the Choose an ingestion source page, select OpenTelemetry.
ClickStack generates the collector command with the default administrator credentials. We recommend dedicated ingestion credentials to keep ingestion access separate from administration and avoid relying on the administrator password.
Create dedicated ingestion credentials (recommended)
In ClickHouse Cloud, open your service’s SQL console and run:
CREATE USER `clickstack-ingest` IDENTIFIED WITH sha256_password BY '<password>';
GRANT SELECT, INSERT, CREATE DATABASE, CREATE TABLE, CREATE VIEW ON default.* TO `clickstack-ingest`;
In the generated command, replace CLICKHOUSE_USER="default" with CLICKHOUSE_USER="clickstack-ingest" and set CLICKHOUSE_PASSWORD to the dedicated user’s password.
To continue with the default administrator credentials, copy the command from the Start Collector tab. ClickStack pre-populates the service endpoint. Replace the password placeholder with your service password. If you no longer have it, gather or reset your connection details.
The command follows this format:
docker run -e CLICKHOUSE_ENDPOINT="https://<host>:8443" \
    -e CLICKHOUSE_USER="default" \
    -e CLICKHOUSE_PASSWORD="<your_password_here>" \
    -p 4317:4317 -p 4318:4318 \
    clickhouse/clickstack-otel-collector:latest
Replace <host> and <your_password_here> with the values for your ClickHouse Cloud service, then run the command.
The collector runs in the foreground. Leave this terminal open and use a second terminal for the remaining commands in this guide.
Select Configure existing collector, then adapt your collector configuration.
Run the collector as a gateway between your applications and ClickHouse Cloud. The configuration below adds the required ClickHouse exporters and signal pipelines.
The example uses the default credentials generated by ClickStack. To use dedicated ingestion credentials, follow the optional setup on the Start a new collector tab. In both ClickHouse exporter blocks, replace username: default with username: clickstack-ingest and set password to the dedicated user’s password.
Merge the following components into your existing configuration rather than replacing unrelated receivers, processors, exporters, or extensions.
The example adds OTLP receivers, batching and memory limiting, Session Replay routing, and ClickHouse exporters.
Replace the endpoint and password placeholders with the credentials generated by ClickStack:
receivers:
  otlp/hyperdx:
    protocols:
      grpc:
        include_metadata: true
        endpoint: "0.0.0.0:4317"
      http:
        cors:
          allowed_origins: ["*"]
          allowed_headers: ["*"]
        include_metadata: true
        endpoint: "0.0.0.0:4318"
processors:
  batch:
  memory_limiter:
    # 80% of maximum memory up to 2G, adjust for low memory environments
    limit_mib: 1500
    # 25% of limit up to 2G, adjust for low memory environments
    spike_limit_mib: 512
    check_interval: 5s
connectors:
  routing/logs:
    default_pipelines: [logs/out-default]
    error_mode: ignore
    table:
      - context: log
        statement: route() where IsMatch(attributes["rr-web.event"], ".*")
        pipelines: [logs/out-rrweb]
exporters:
  clickhouse/rrweb:
    database: default
    endpoint: <clickhouse_cloud_endpoint>
    password: <your_password_here>
    username: default
    ttl: 720h
    logs_table_name: hyperdx_sessions
    timeout: 5s
    retry_on_failure:
      enabled: true
      initial_interval: 5s
      max_interval: 30s
      max_elapsed_time: 300s
  clickhouse:
    database: default
    endpoint: <clickhouse_cloud_endpoint>
    password: <your_password_here>
    username: default
    ttl: 720h
    timeout: 5s
    retry_on_failure:
      enabled: true
      initial_interval: 5s
      max_interval: 30s
      max_elapsed_time: 300s

service:
  pipelines:
    traces:
      receivers: [otlp/hyperdx]
      processors: [memory_limiter, batch]
      exporters: [clickhouse]
    metrics:
      receivers: [otlp/hyperdx]
      processors: [memory_limiter, batch]
      exporters: [clickhouse]
    logs/in:
      receivers: [otlp/hyperdx]
      exporters: [routing/logs]
    logs/out-default:
      receivers: [routing/logs]
      processors: [memory_limiter, batch]
      exporters: [clickhouse]
    logs/out-rrweb:
      receivers: [routing/logs]
      processors: [memory_limiter, batch]
      exporters: [clickhouse/rrweb]
Reuse your existing OTLP receiver and preserve its authentication and TLS settings. If your configuration already uses the component or pipeline IDs in the example, merge or rename them instead of creating duplicate IDs. Running two receivers on ports 4317 and 4318 causes a port conflict.
After merging the configuration, reload or restart the collector using your existing deployment process.
For further details on configuring OpenTelemetry collectors, see Ingesting with OpenTelemetry.
Send test data
Send a test log with the current timestamp:
NOW_NANO="$(date +%s)000000000"

curl -i "http://localhost:4318/v1/logs" \
  -H "Content-Type: application/json" \
  --data-binary @- <<EOF
{
  "resourceLogs": [{
    "resource": {
      "attributes": [{
        "key": "service.name",
        "value": {"stringValue": "clickstack-docs-test"}
      }]
    },
    "scopeLogs": [{
      "scope": {"name": "clickstack-docs-test"},
      "logRecords": [{
        "timeUnixNano": "${NOW_NANO}",
        "severityText": "INFO",
        "body": {"stringValue": "ClickStack ingestion test"}
      }]
    }]
  }]
}
EOF
If you use an existing collector, replace http://localhost:4318 with its OTLP HTTP endpoint. If the receiver requires authentication, add the required header to the curl command.
A successful request returns HTTP/1.1 200 OK.
Start exploring and confirm ingestion
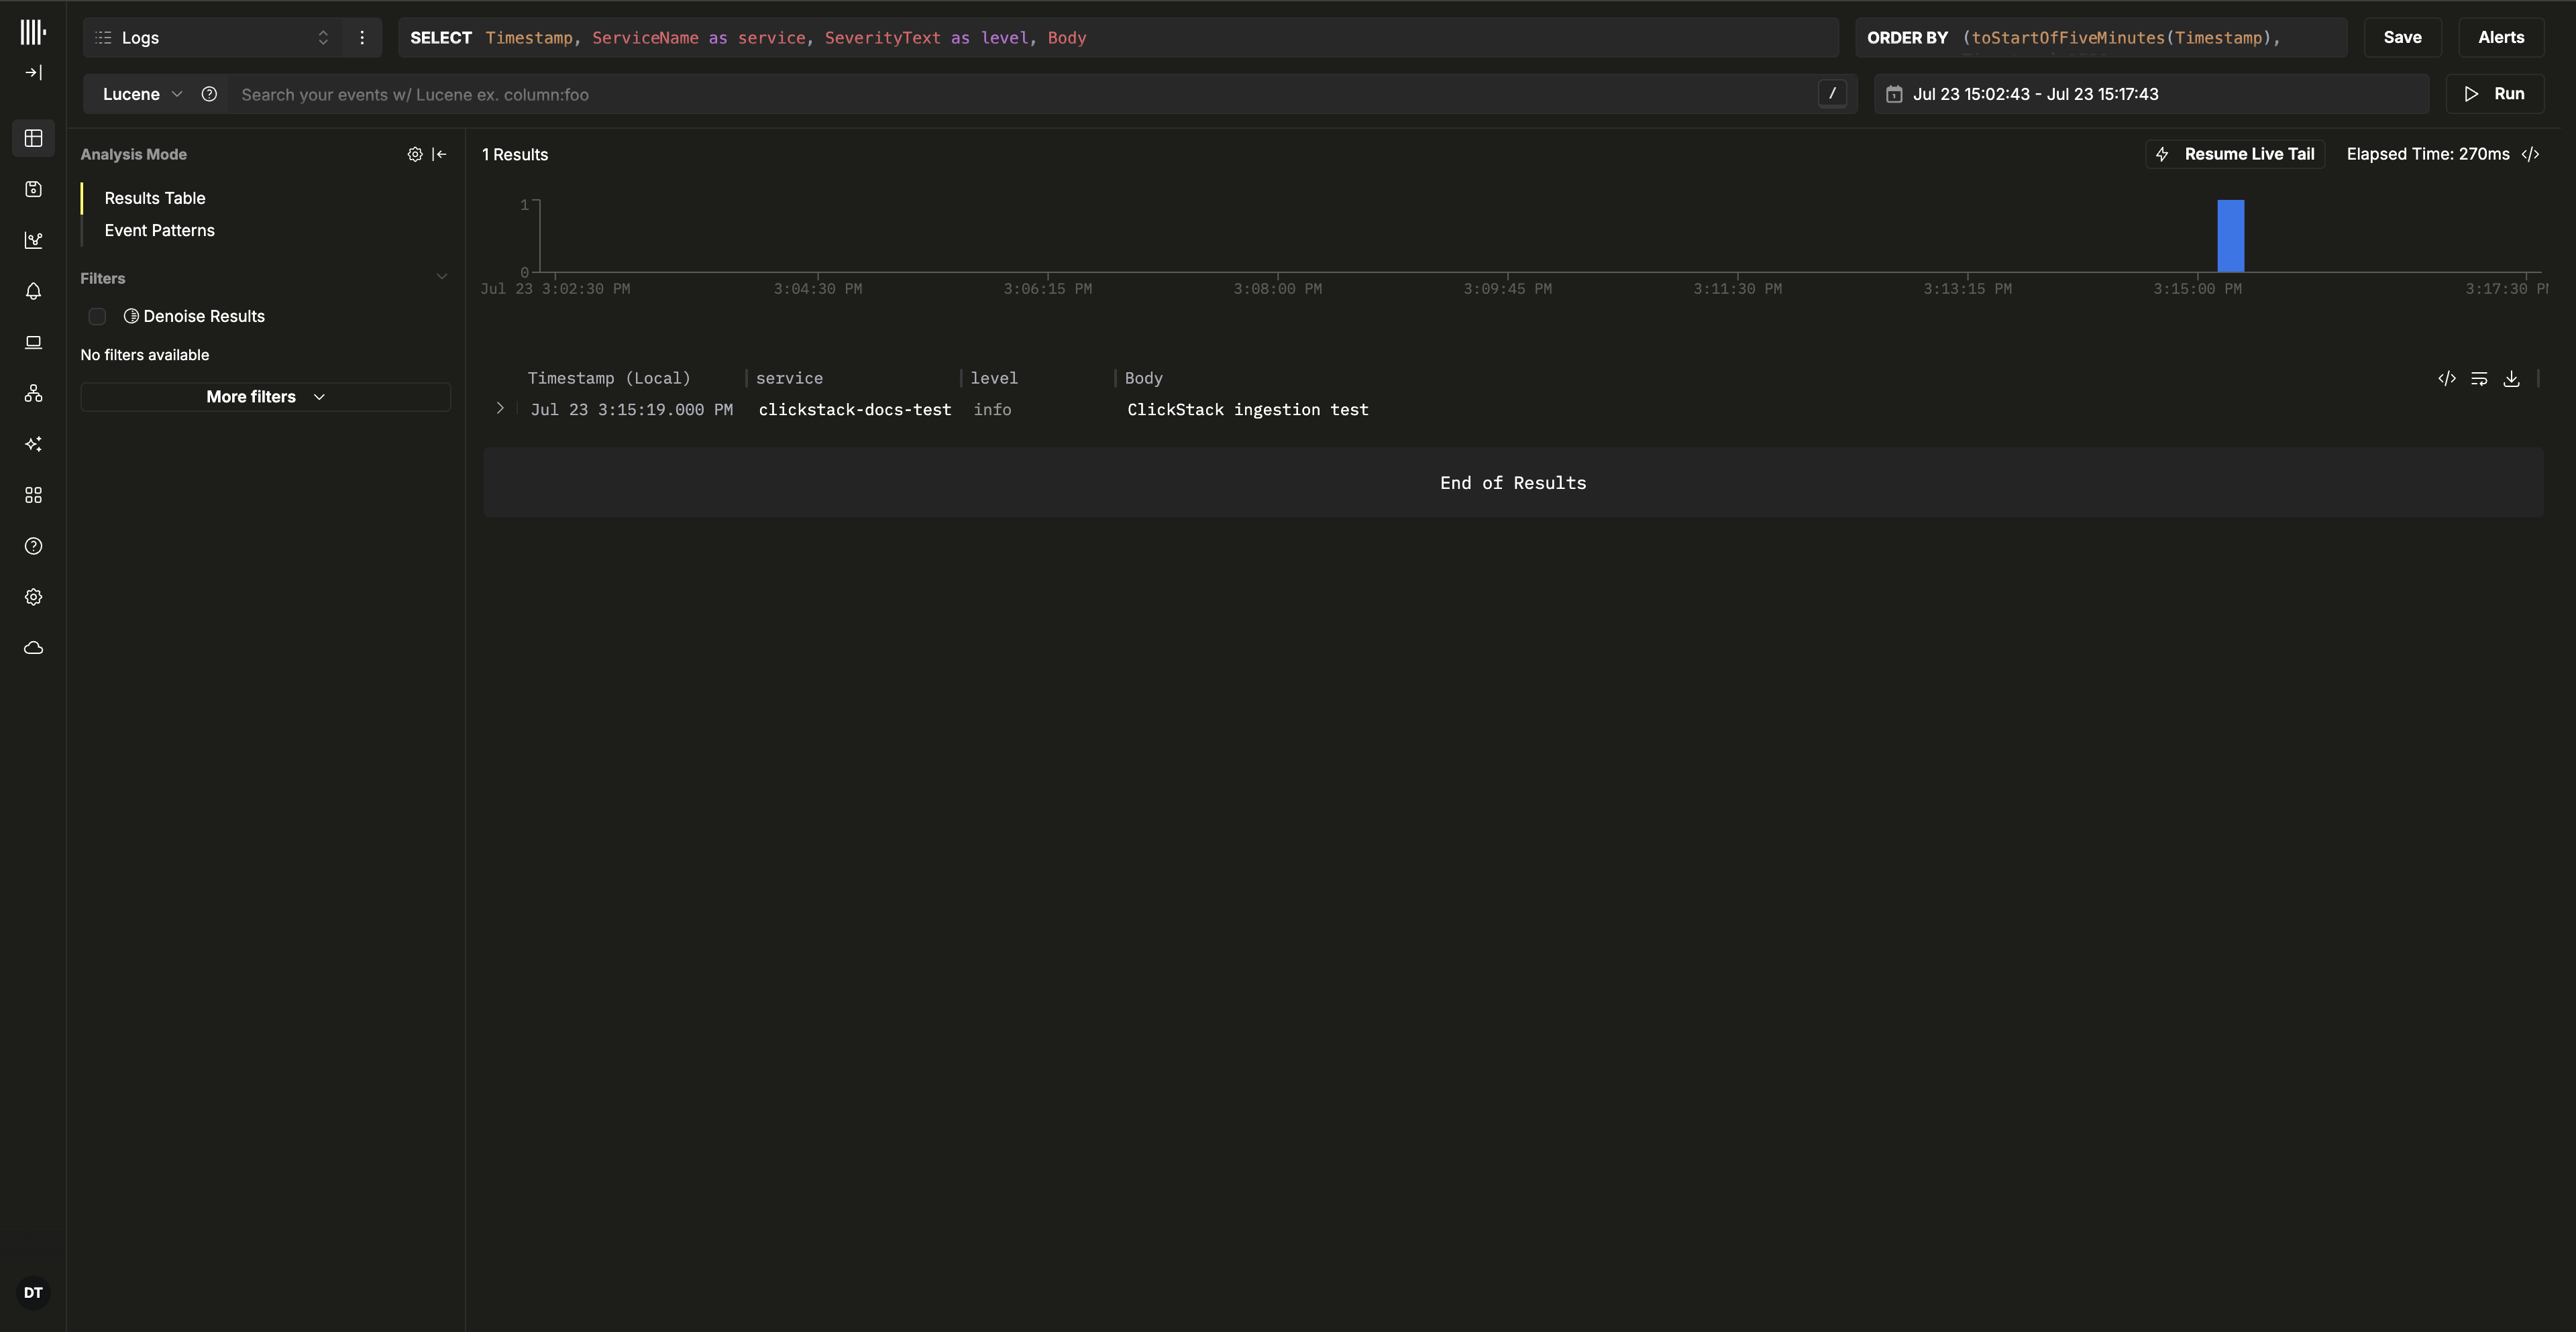
After ClickStack detects the OpenTelemetry data sources, select Start exploring to open the Search view. Search for ClickStack ingestion test.
The result should include the test event with the clickstack-docs-test service name.
Prepare your ingestion environment
Start with an existing Vector pipeline that can send data to ClickHouse.
Set up Managed ClickStack
Choose Vector and configure ingestion
From your ClickHouse Cloud service, launch ClickStack. On the ClickStack Getting Started page, select Start ingestion.
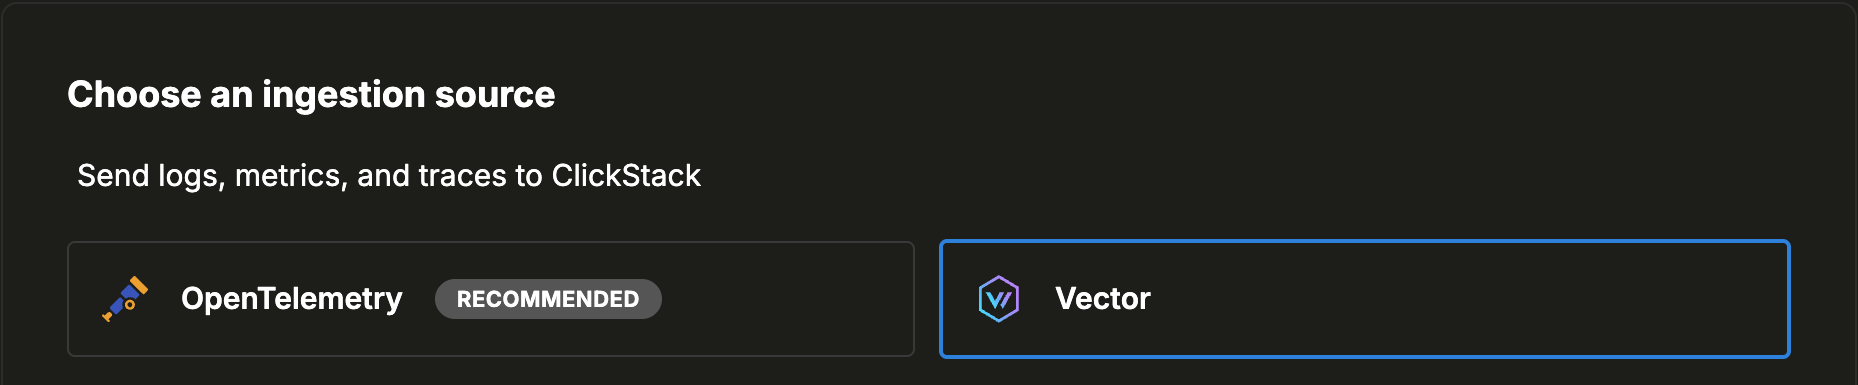
On the Choose an ingestion source page, select Vector.
Vector is a high-performance, vendor-neutral observability data pipeline, especially popular for log ingestion due to its flexibility and low resource footprint.
When using Vector with ClickStack, you define the schema. It can follow OpenTelemetry conventions or use fields specific to your events.
Create a database and table
Create a database and table before configuring the Vector sink.
In ClickHouse Cloud, open your service’s SQL console and create a database:
For example, create a database for logs:
CREATE DATABASE IF NOT EXISTS logsThen create a table whose schema matches the structure of your log data. The example below assumes a classic Nginx access log format:
CREATE TABLE logs.nginx_logs
(
    `time_local` DateTime,
    `remote_addr` IPv4,
    `remote_user` LowCardinality(String),
    `request` String,
    `status` UInt16,
    `body_bytes_sent` UInt64,
    `http_referer` String,
    `http_user_agent` String,
    `http_x_forwarded_for` LowCardinality(String),
    `request_time` Float32,
    `upstream_response_time` Float32,
    `http_host` String
)
ENGINE = MergeTree
ORDER BY (toStartOfMinute(time_local), status, remote_addr);
Your table must align with the output schema produced by Vector. Adjust the schema as needed for your data, following the recommended schema best practices.
We strongly recommend understanding how Primary keys work in ClickHouse and choosing an ordering key based on your access patterns. See the ClickStack-specific guidance on choosing a primary key.
Configure the ClickHouse sink
Once the table exists, add a ClickHouse sink to your Vector configuration:
sinks:
  clickhouse:
    type: clickhouse
    inputs:
      - your_input
    endpoint: "https://<host>:8443"
    database: logs
    table: nginx_logs
    format: json_each_row
    skip_unknown_fields: true
    auth:
      strategy: basic
      user: default
      password: "<your_password_here>"
Replace your_input with the input from your existing pipeline. Replace <host> and <your_password_here> with the values for your ClickHouse Cloud service. If required, change the target database or table.
Use dedicated ingestion credentials (recommended)
For production, create a dedicated user and grant it access to the Vector target table. In ClickHouse Cloud, open your service’s SQL console and run:
CREATE USER `clickstack-ingest` IDENTIFIED WITH sha256_password BY '<password>';
GRANT SELECT, INSERT ON logs.nginx_logs TO `clickstack-ingest`;
Replace default with clickstack-ingest in the Vector sink and set password to the dedicated user’s password.
Save the updated configuration, then reload or restart Vector using your existing deployment process.
For more examples of ingesting data with Vector, see Ingesting with Vector or the Vector ClickHouse sink documentation for advanced options.
Create a ClickStack data source
Create a data source for the table populated by your Vector pipeline. ClickStack prompts you to create one on your first login.
The form pre-populates expressions for the default OpenTelemetry schema. For the Nginx table created in this guide, configure the source with these values:
| Setting | Value |
|---|---|
| Name | Nginx logs |
| Source Data Type | Log |
| Server Connection | Default |
| Database | logs |
| Table | nginx_logs |
| Timestamp Column | time_local |
| Default SELECT | time_local, remote_addr, status, request |
| Service Name Expression | 'nginx' |
| Log Level Expression | multiIf(status >= 500, 'ERROR', status >= 400, 'WARN', 'INFO') |
| Log Attributes Expression | map('http.remote_addr', toString(remote_addr), 'http.status_code', toString(status), 'http.request', request) |
| Resource Attributes Expression | map('service.name', 'nginx') |
| Displayed Timestamp Column | time_local |
| Trace ID Expression | '' |
| Span ID Expression | '' |
| Implicit Column Expression | request |
The Nginx table doesn’t contain a Body column. Set Body Expression to:
concat(
  remote_addr, ' ',
  remote_user, ' ',
  '[', formatDateTime(time_local, '%d/%b/%Y:%H:%i:%S %z'), '] ',
  '"', request, '" ',
  toString(status), ' ',
  toString(body_bytes_sent), ' ',
  '"', http_referer, '" ',
  '"', http_user_agent, '" ',
  '"', http_x_forwarded_for, '" ',
  toString(request_time), ' ',
  toString(upstream_response_time), ' ',
  '"', http_host, '"'
)
For other source settings, see the ClickStack configuration reference.
Send test data
Send a representative event through the input of your existing Vector pipeline.
For more Vector source and transformation examples, see Ingesting with Vector.
Start exploring and confirm ingestion
After creating the data source, select Start exploring to open the Search view. Select the data source for your table and confirm that it contains the event you sent.
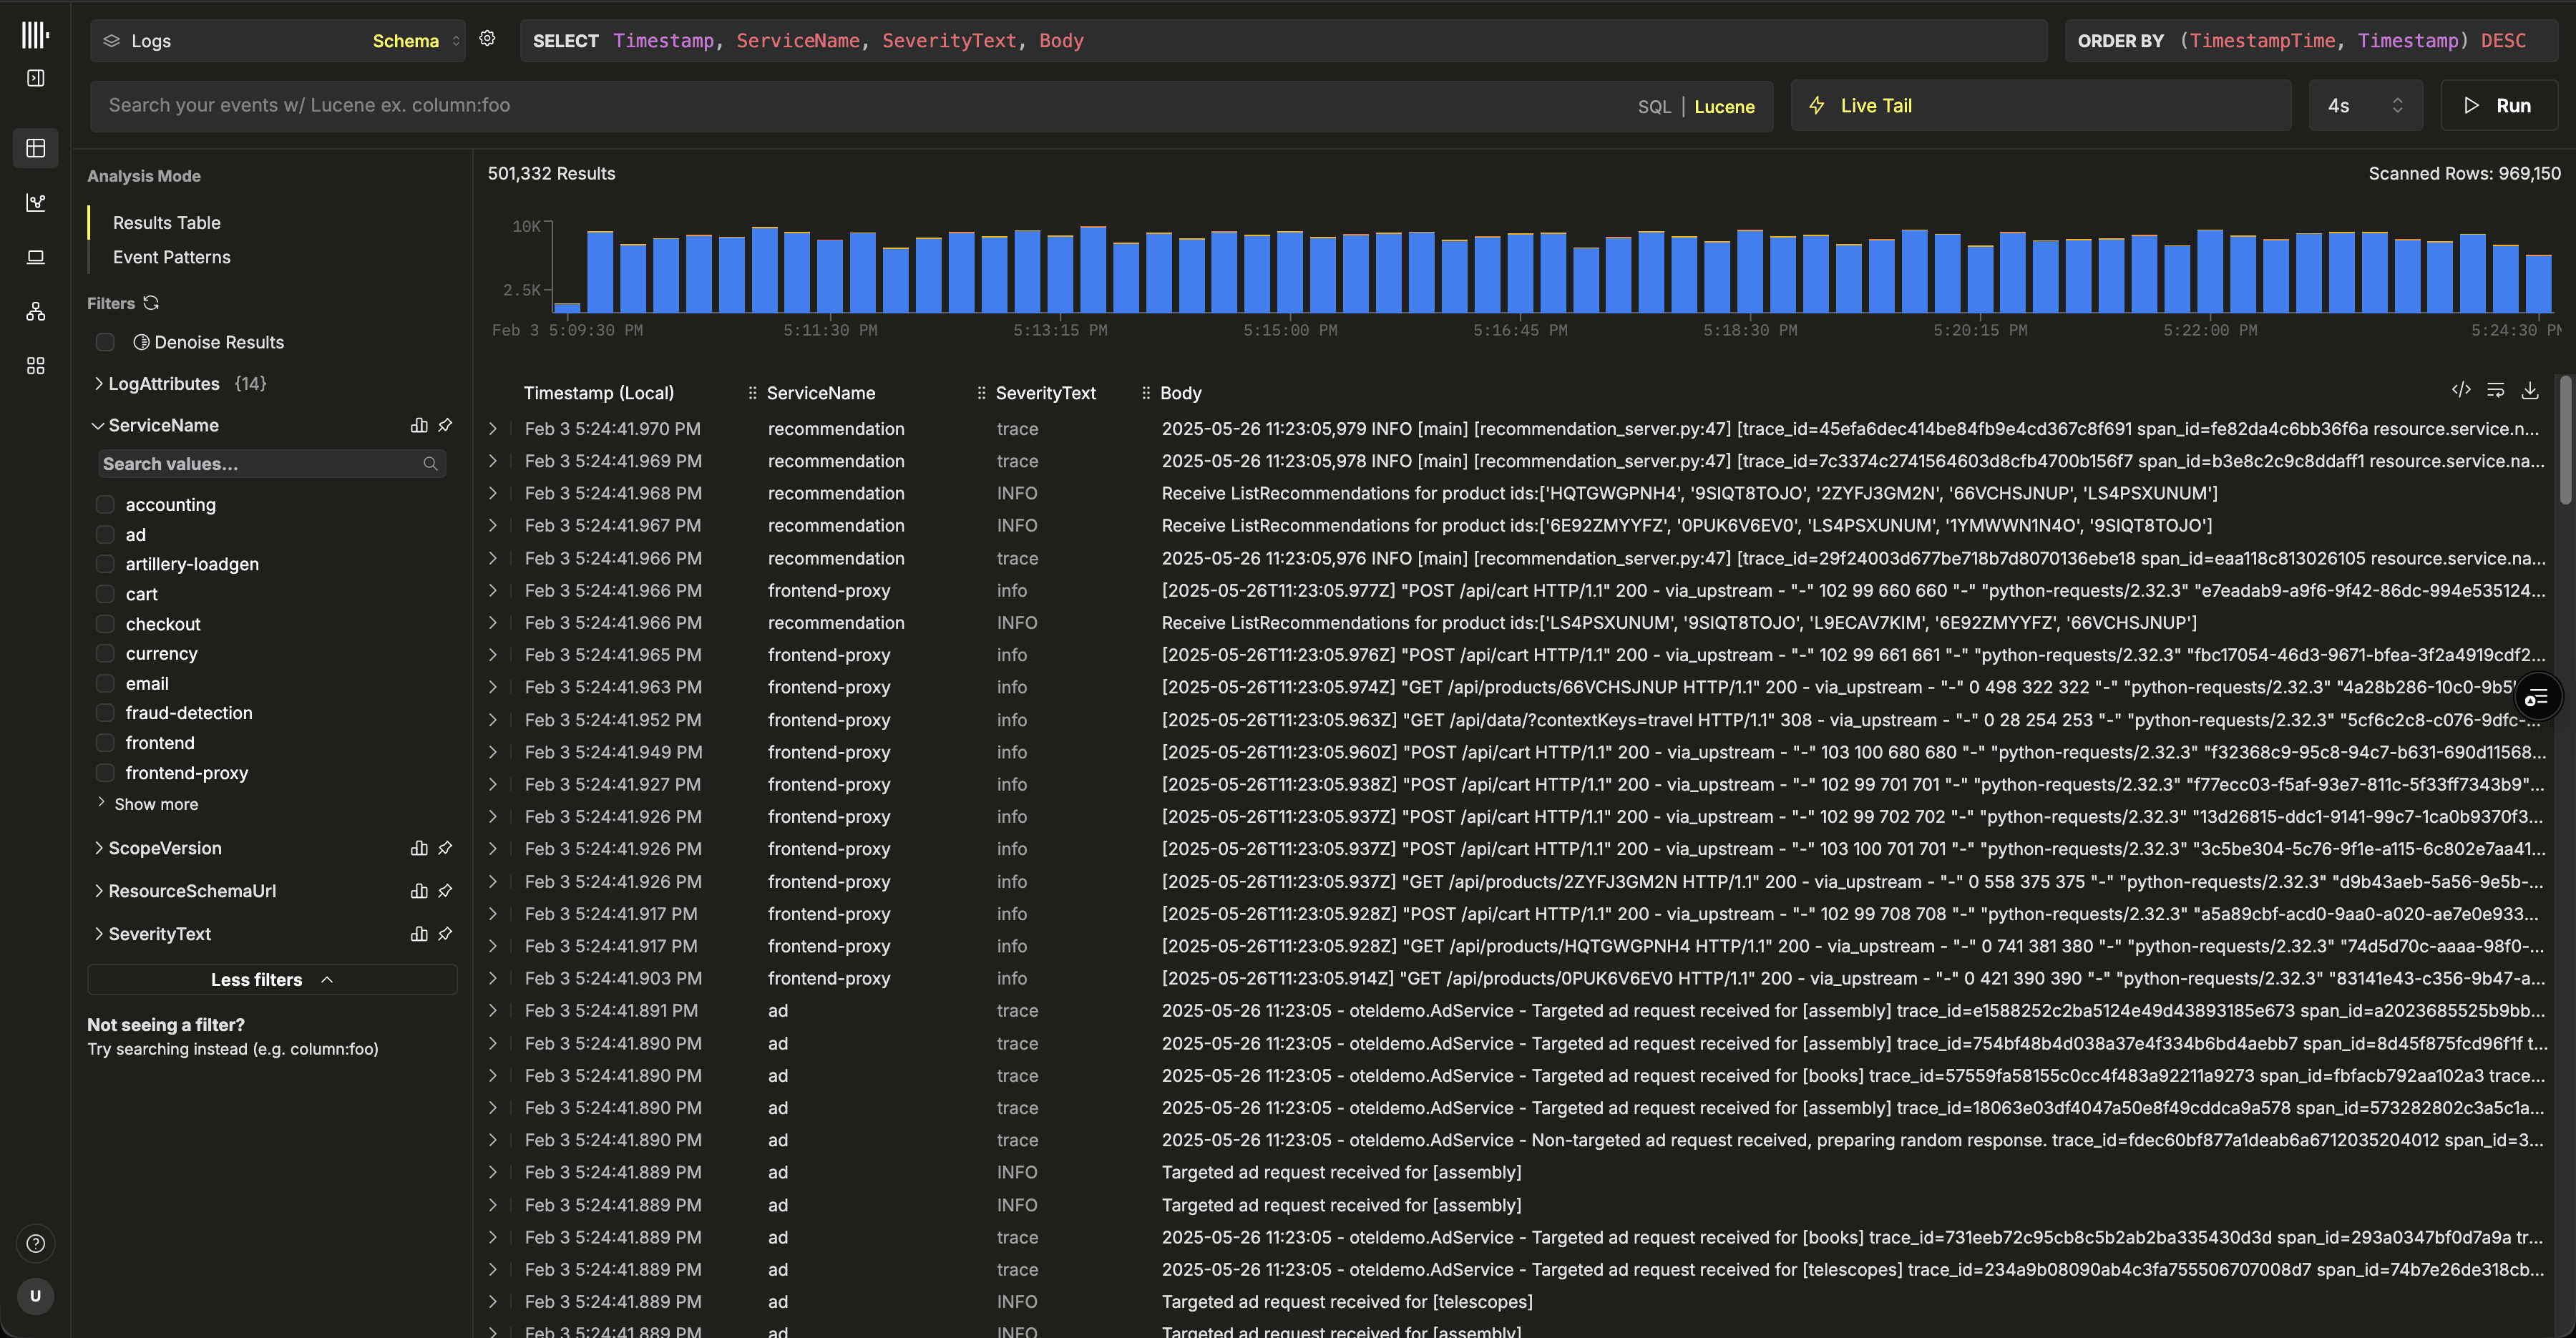
You now have a Managed ClickStack service, a working ingestion path, and a test event that you can inspect in ClickStack.
Next steps
If another guide requires your ClickHouse Cloud endpoint or password, gather or reset your connection details before continuing.
Send application and infrastructure data
Choose a guide for the data that you want to send to ClickStack:
Instrument an application
Send application traces and logs with a supported OpenTelemetry SDK.
Collect host logs
Forward host logs from an OpenTelemetry Collector running in the agent role.
Monitor Kubernetes
Collect logs, metrics, and traces from a Kubernetes cluster.
Explore other integrations
Find guides for additional applications and telemetry sources.
Explore sample data
Use a sample dataset to explore ClickStack with richer telemetry:
Sample logs, traces, and metrics
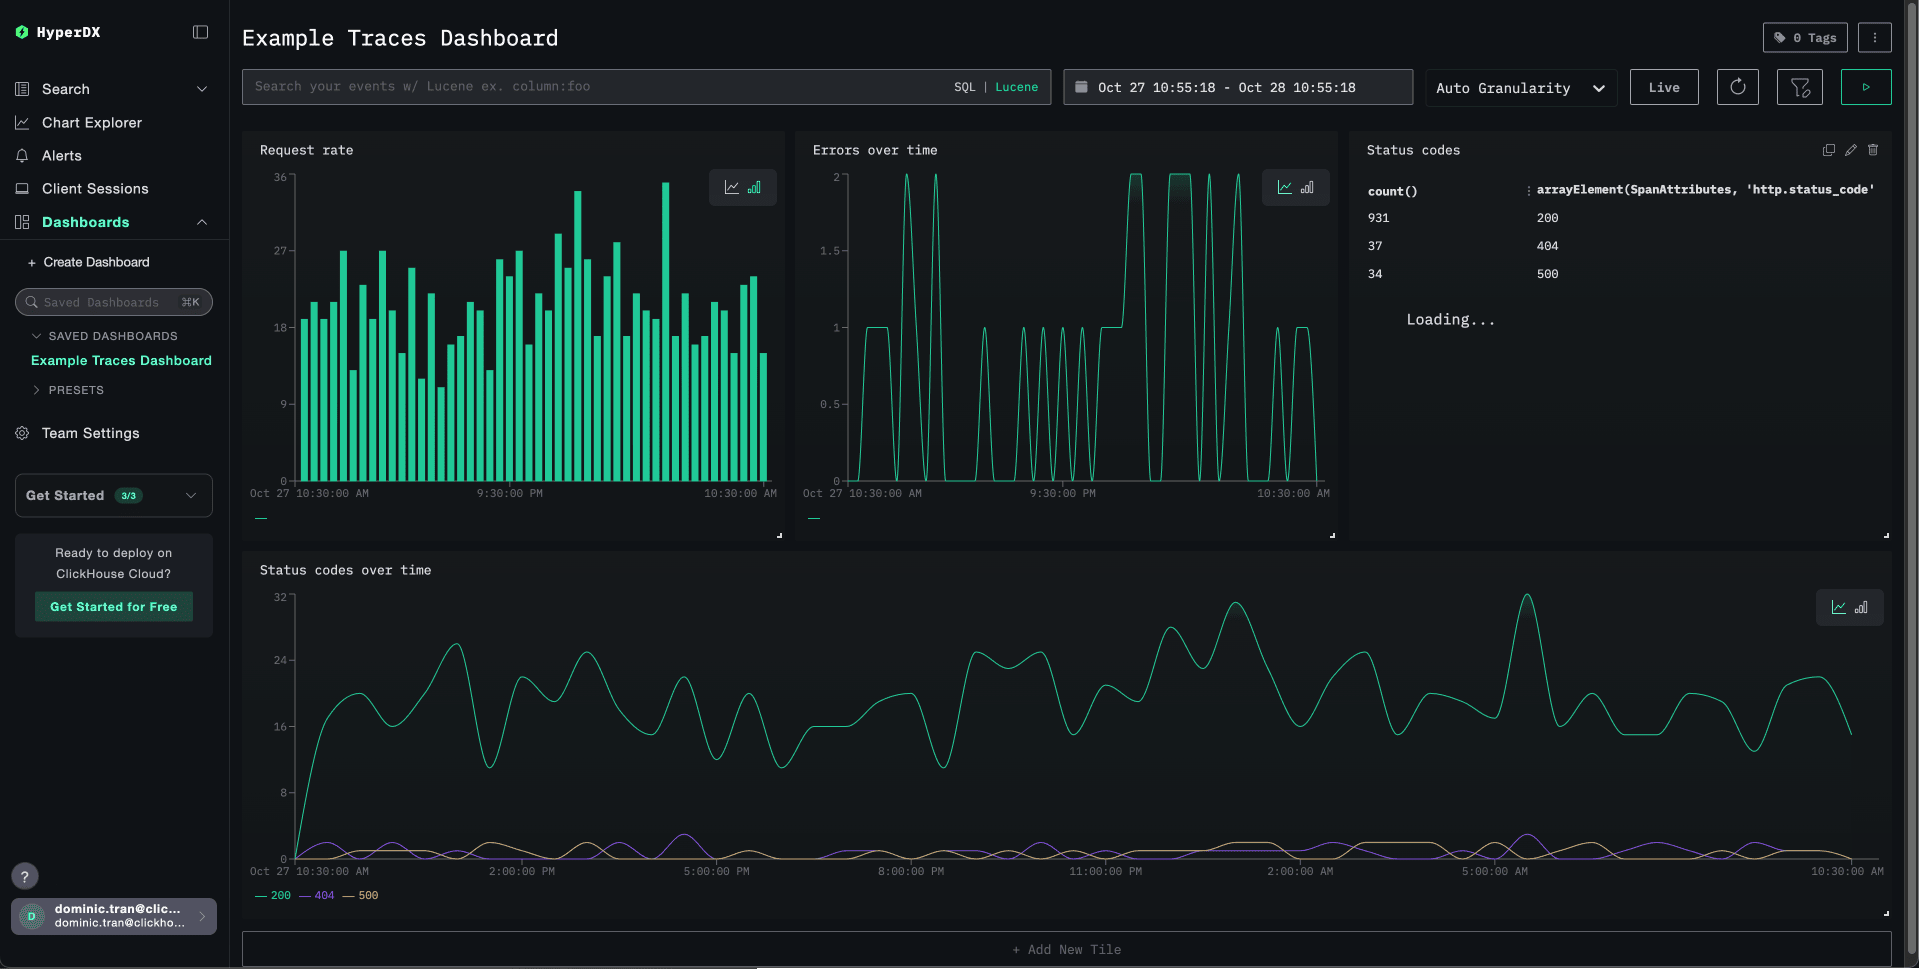
Load data from the public demo and diagnose an issue. This guide assumes that you started a new local OpenTelemetry Collector. If you configured an existing collector, adapt the endpoint and authentication settings to your deployment.
Local logs and metrics
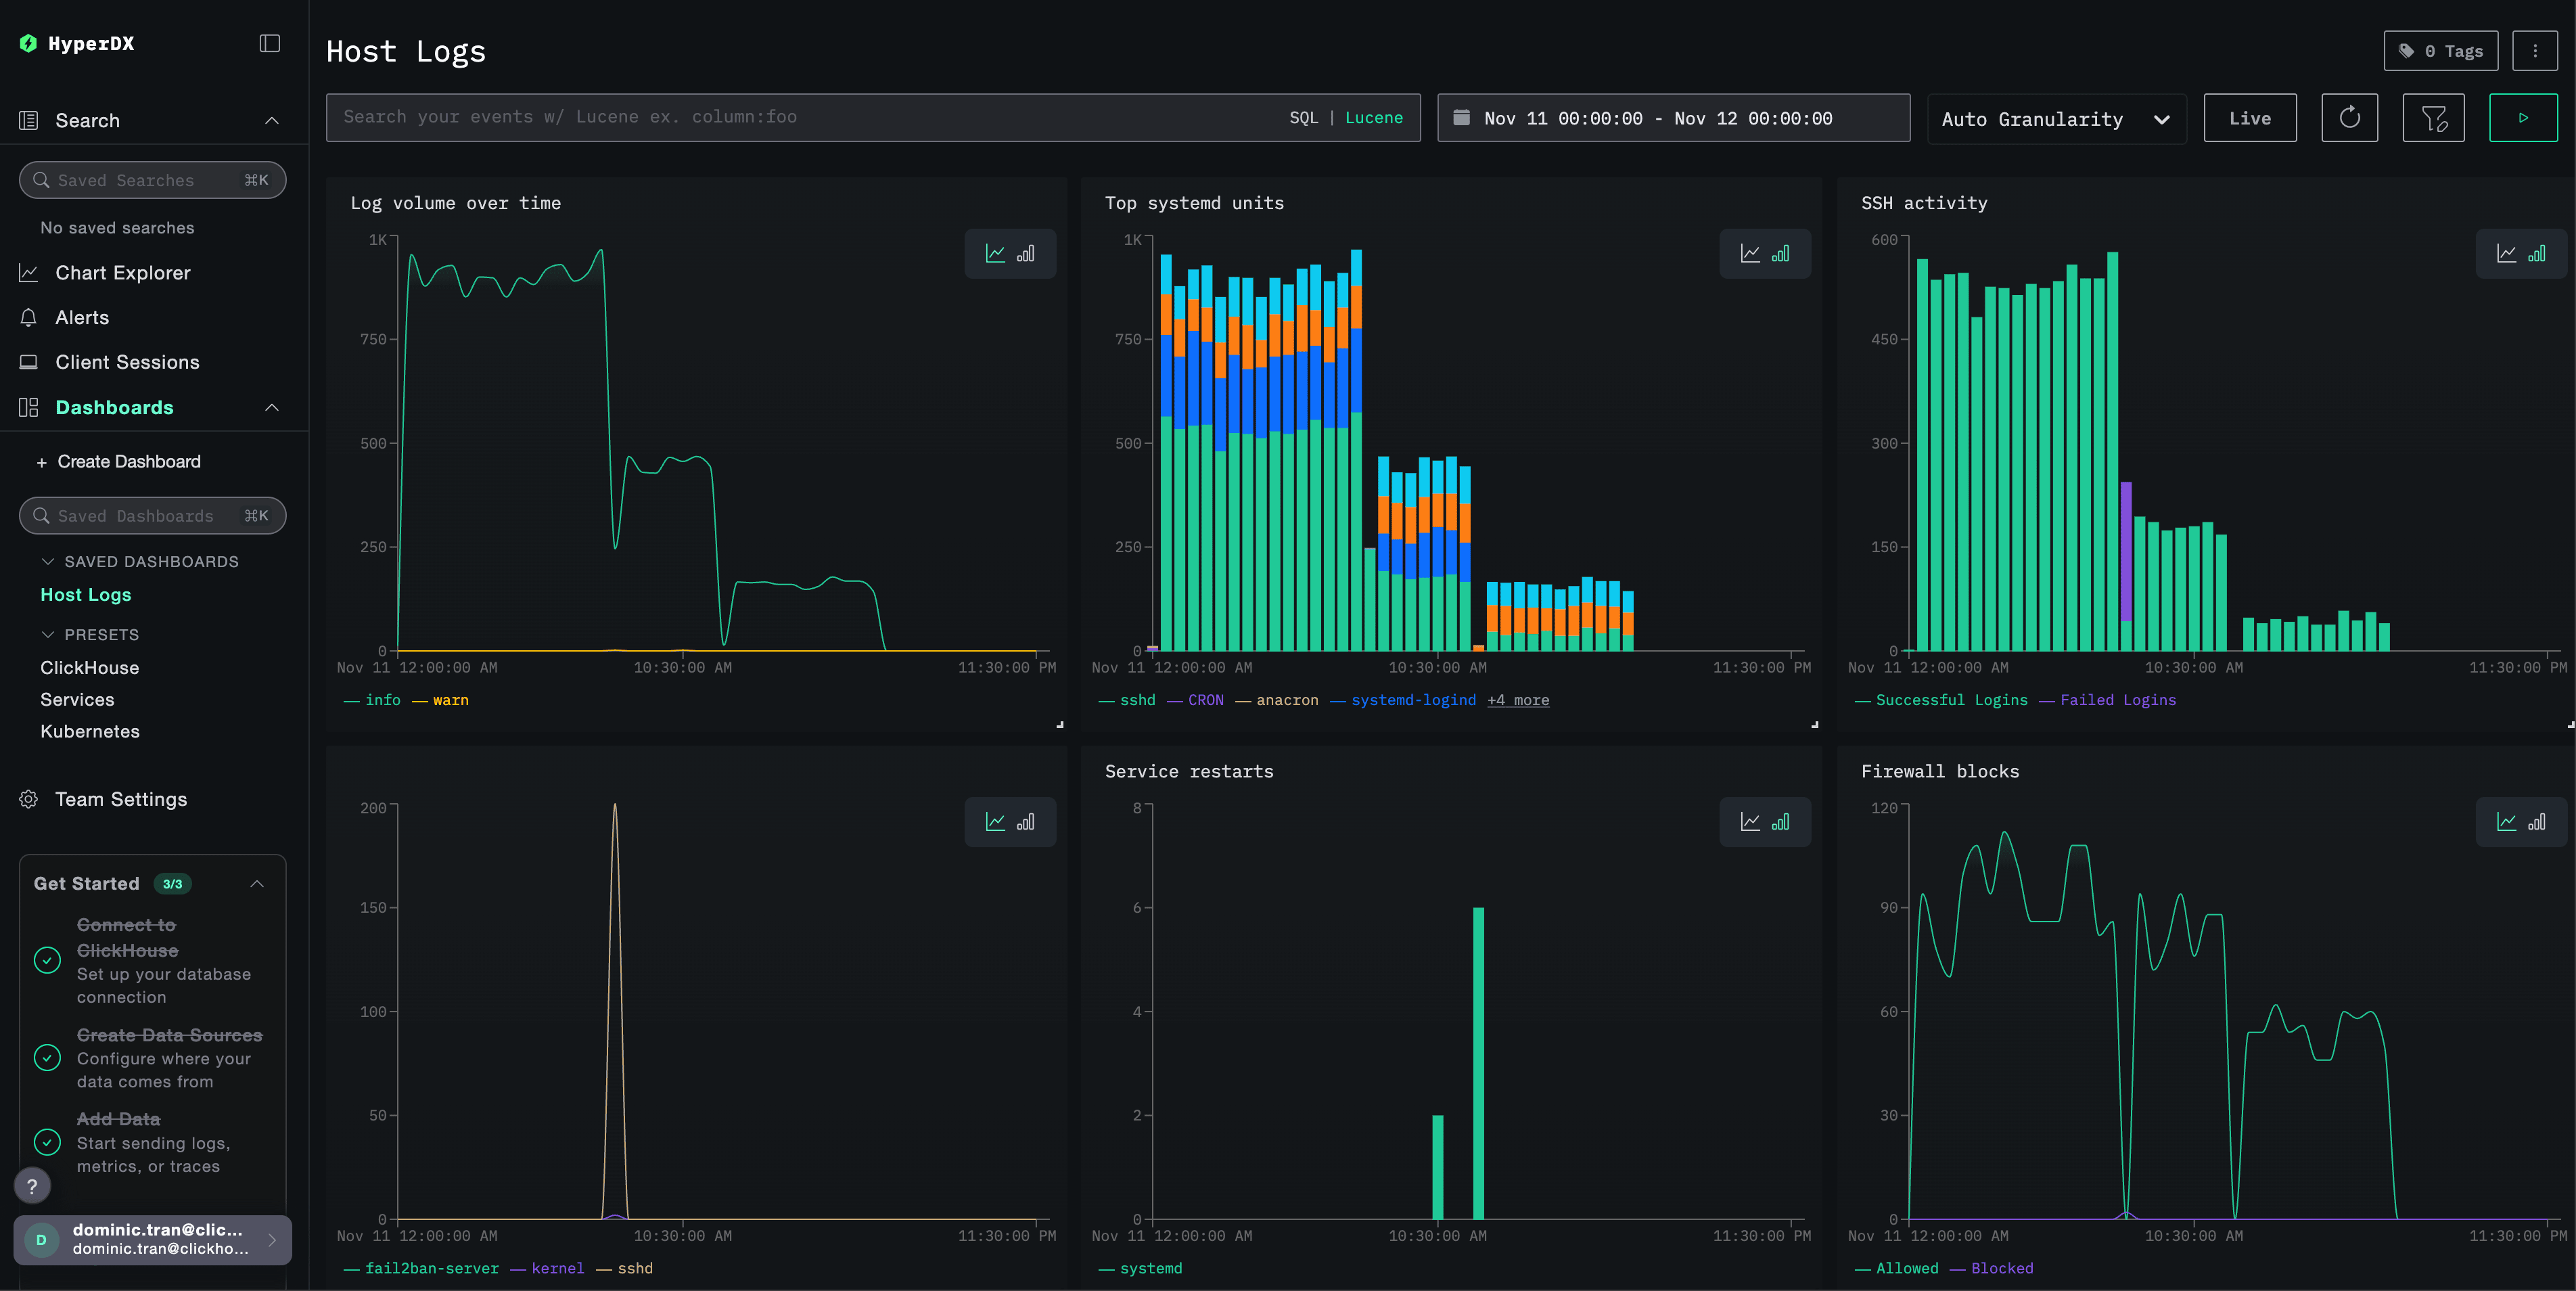
Collect local files and system metrics on macOS or Linux.
Generate synthetic data
Use a generator to test ingestion without an existing application or dataset:
Generate data with otelgen
Send a short burst of synthetic OTLP logs, traces, and metrics.
Generate data with telemetrygen
Generate configurable OpenTelemetry signals across several services.
See all ClickStack sample data and demos.
Prepare for production
Review production and sizing guidance before using ClickStack for sustained workloads:
Going to production
Review ingestion credentials, security, retention, and operational guidance.
Estimate resources
Size compute for your expected ingest volume.
For deployment tasks, see the Managed ClickStack deployment guide.