

 Set up docs MCP
This getting started guide allows you to collect local logs and metrics from your system, sending them to ClickStack for visualization and analysis.
This example works on OSX and Linux systems only
This guide assumes you have completed the Getting Started Guide for Managed ClickStack and have the connection credentials recorded.
Create a custom OpenTelemetry configuration
Create a custom-local-config.yaml file with the following content:
receivers:
  filelog:
    include:
      - /host/var/log/**/*.log        # Linux logs from host
      - /host/var/log/syslog
      - /host/var/log/messages
      - /host/private/var/log/*.log   # macOS logs from host
    start_at: beginning
    resource:
      service.name: "system-logs"

  hostmetrics:
    collection_interval: 1s
    scrapers:
      cpu:
        metrics:
          system.cpu.time:
            enabled: true
          system.cpu.utilization:
            enabled: true
      memory:
        metrics:
          system.memory.usage:
            enabled: true
          system.memory.utilization:
            enabled: true
      filesystem:
        metrics:
          system.filesystem.usage:
            enabled: true
          system.filesystem.utilization:
            enabled: true
      paging:
        metrics:
          system.paging.usage:
            enabled: true
          system.paging.utilization:
            enabled: true
          system.paging.faults:
            enabled: true
      disk:
      load:
      network:
      processes:

service:
  pipelines:
    logs/local:
      receivers: [filelog]
      processors:
        - memory_limiter
        - batch
      exporters:
        - clickhouse
    metrics/hostmetrics:
      receivers: [hostmetrics]
      processors:
        - memory_limiter
        - batch
      exporters:
        - clickhouse
This configuration collects system logs and metrics for OSX and Linux systems, sending the results to ClickStack. The configuration extends the ClickStack collector by adding new receivers and pipelines—you reference the existing clickhouse exporter and processors (memory_limiter, batch) that are already configured in the base ClickStack collector.
For more details on the OpenTelemetry (OTel) configuration structure, we recommend the official guide.
Start the OpenTelemetry collector
Run a standalone collector with the following command:
docker run -d \
  -p 4317:4317 -p 4318:4318 \
  --user 0:0 \
  -e CUSTOM_OTELCOL_CONFIG_FILE=/etc/otelcol-contrib/custom.config.yaml \
  -e CLICKHOUSE_ENDPOINT=${CLICKHOUSE_ENDPOINT} \
  -e CLICKHOUSE_USER=${CLICKHOUSE_USER} \
  -e CLICKHOUSE_PASSWORD=${CLICKHOUSE_PASSWORD} \
  -v "$(pwd)/custom-local-config.yaml:/etc/otelcol-contrib/custom.config.yaml:ro" \
  -v /var/log:/host/var/log:ro \
  -v /private/var/log:/host/private/var/log:ro \
  clickhouse/clickstack-otel-collector:latest
The collector will immediately begin collecting local system logs and metrics.
Select your service
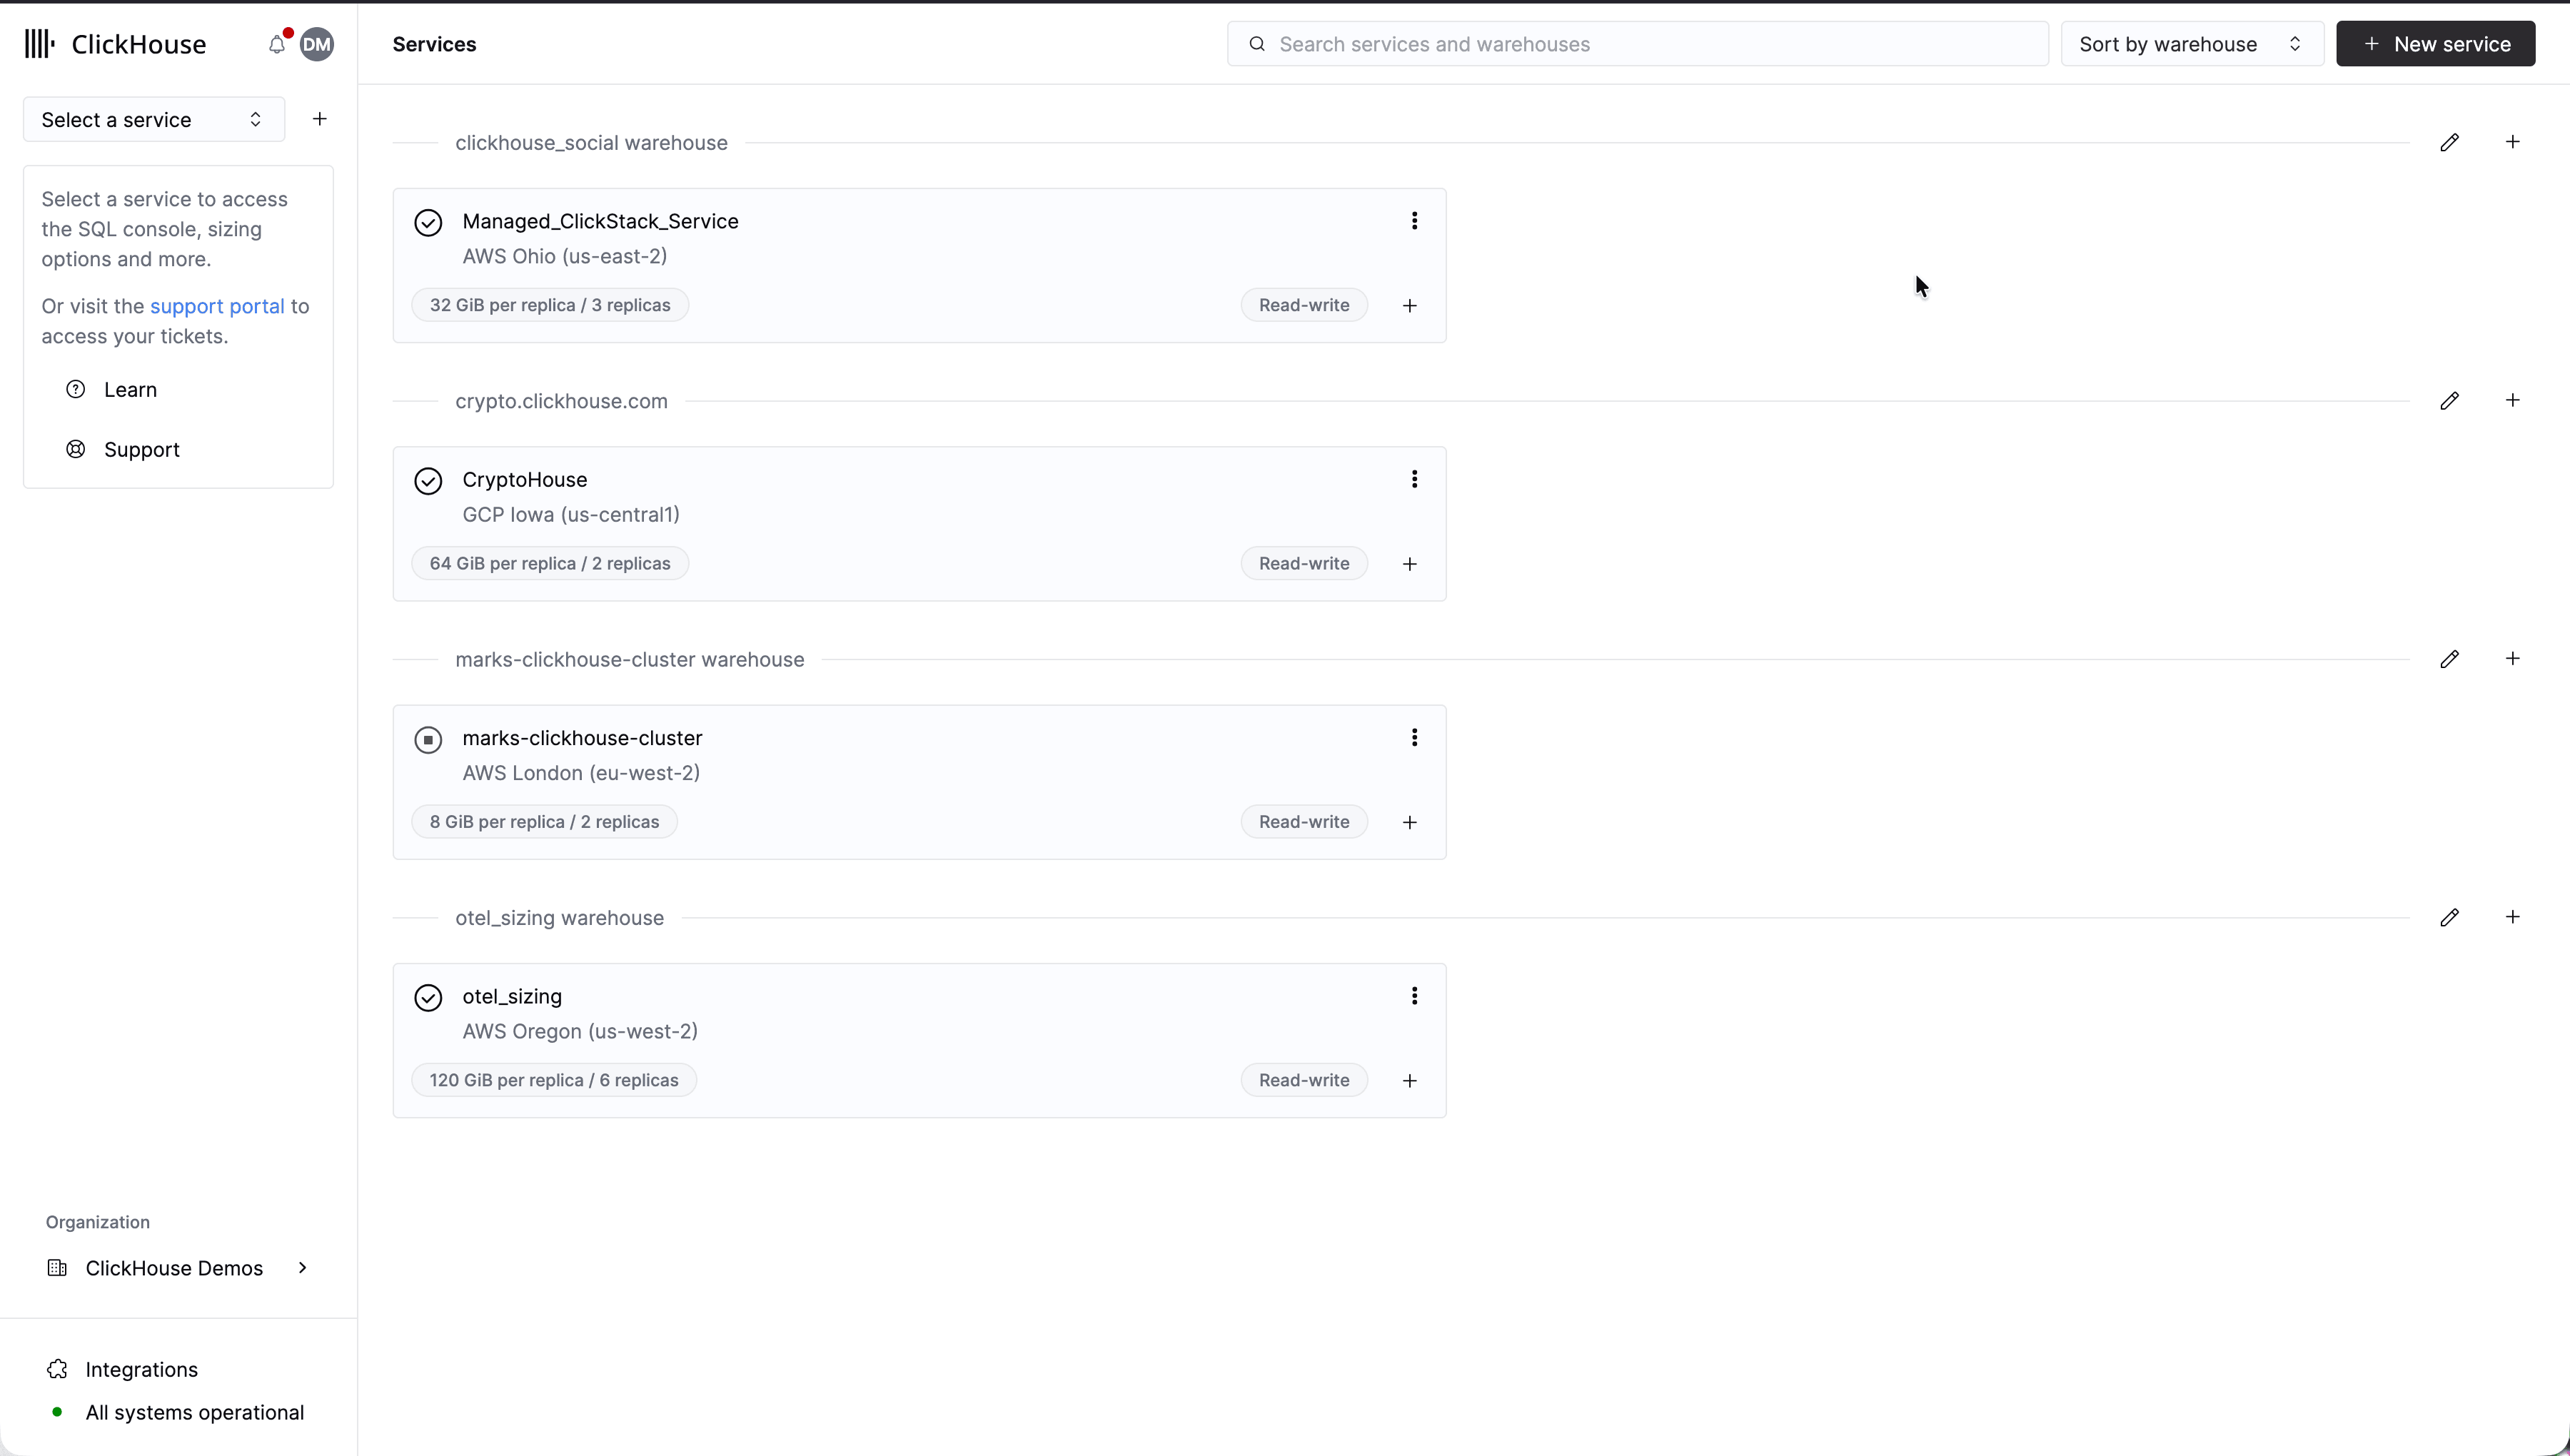
Select the service with Managed ClickStack from the main ClickHouse cloud landing page.
Explore system logs
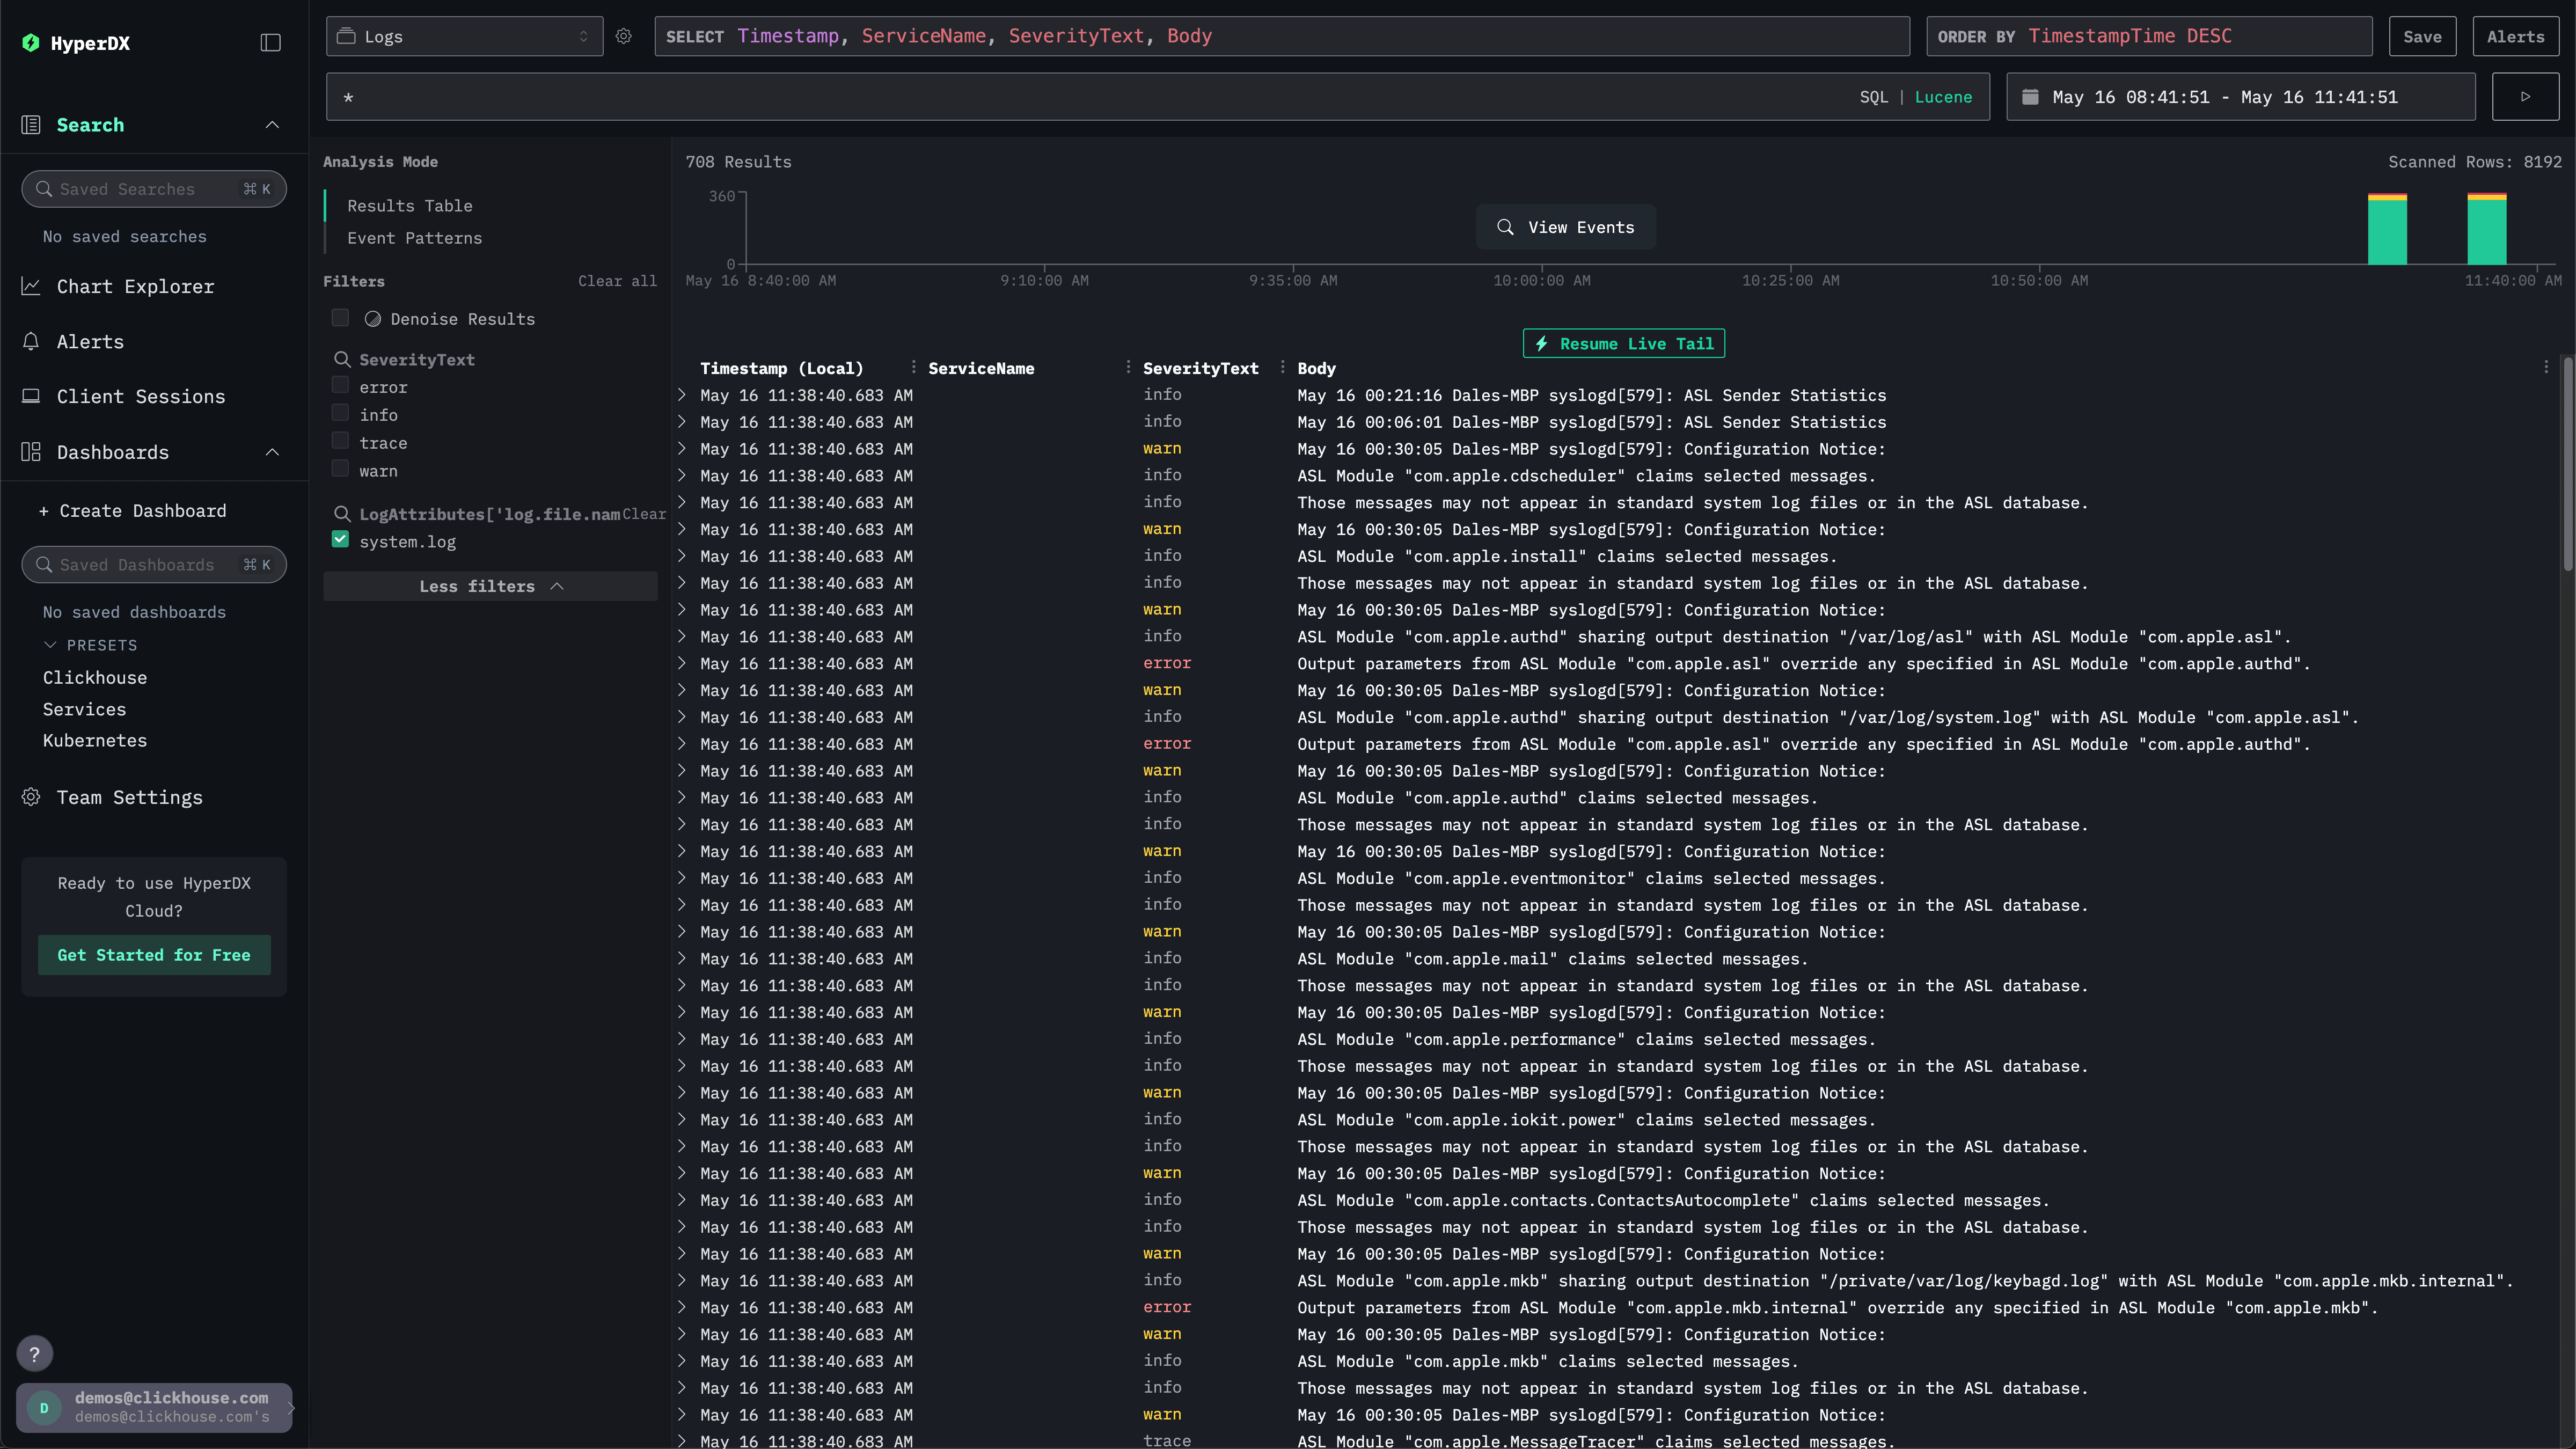
Select ClickStack from the left menu to navigate to the ClickStack UI, where you will be automatically authenticated.
The search UI should be populated with local system logs. Expand the filters to select the system.log:
Explore system metrics
We can explore our metrics using charts.
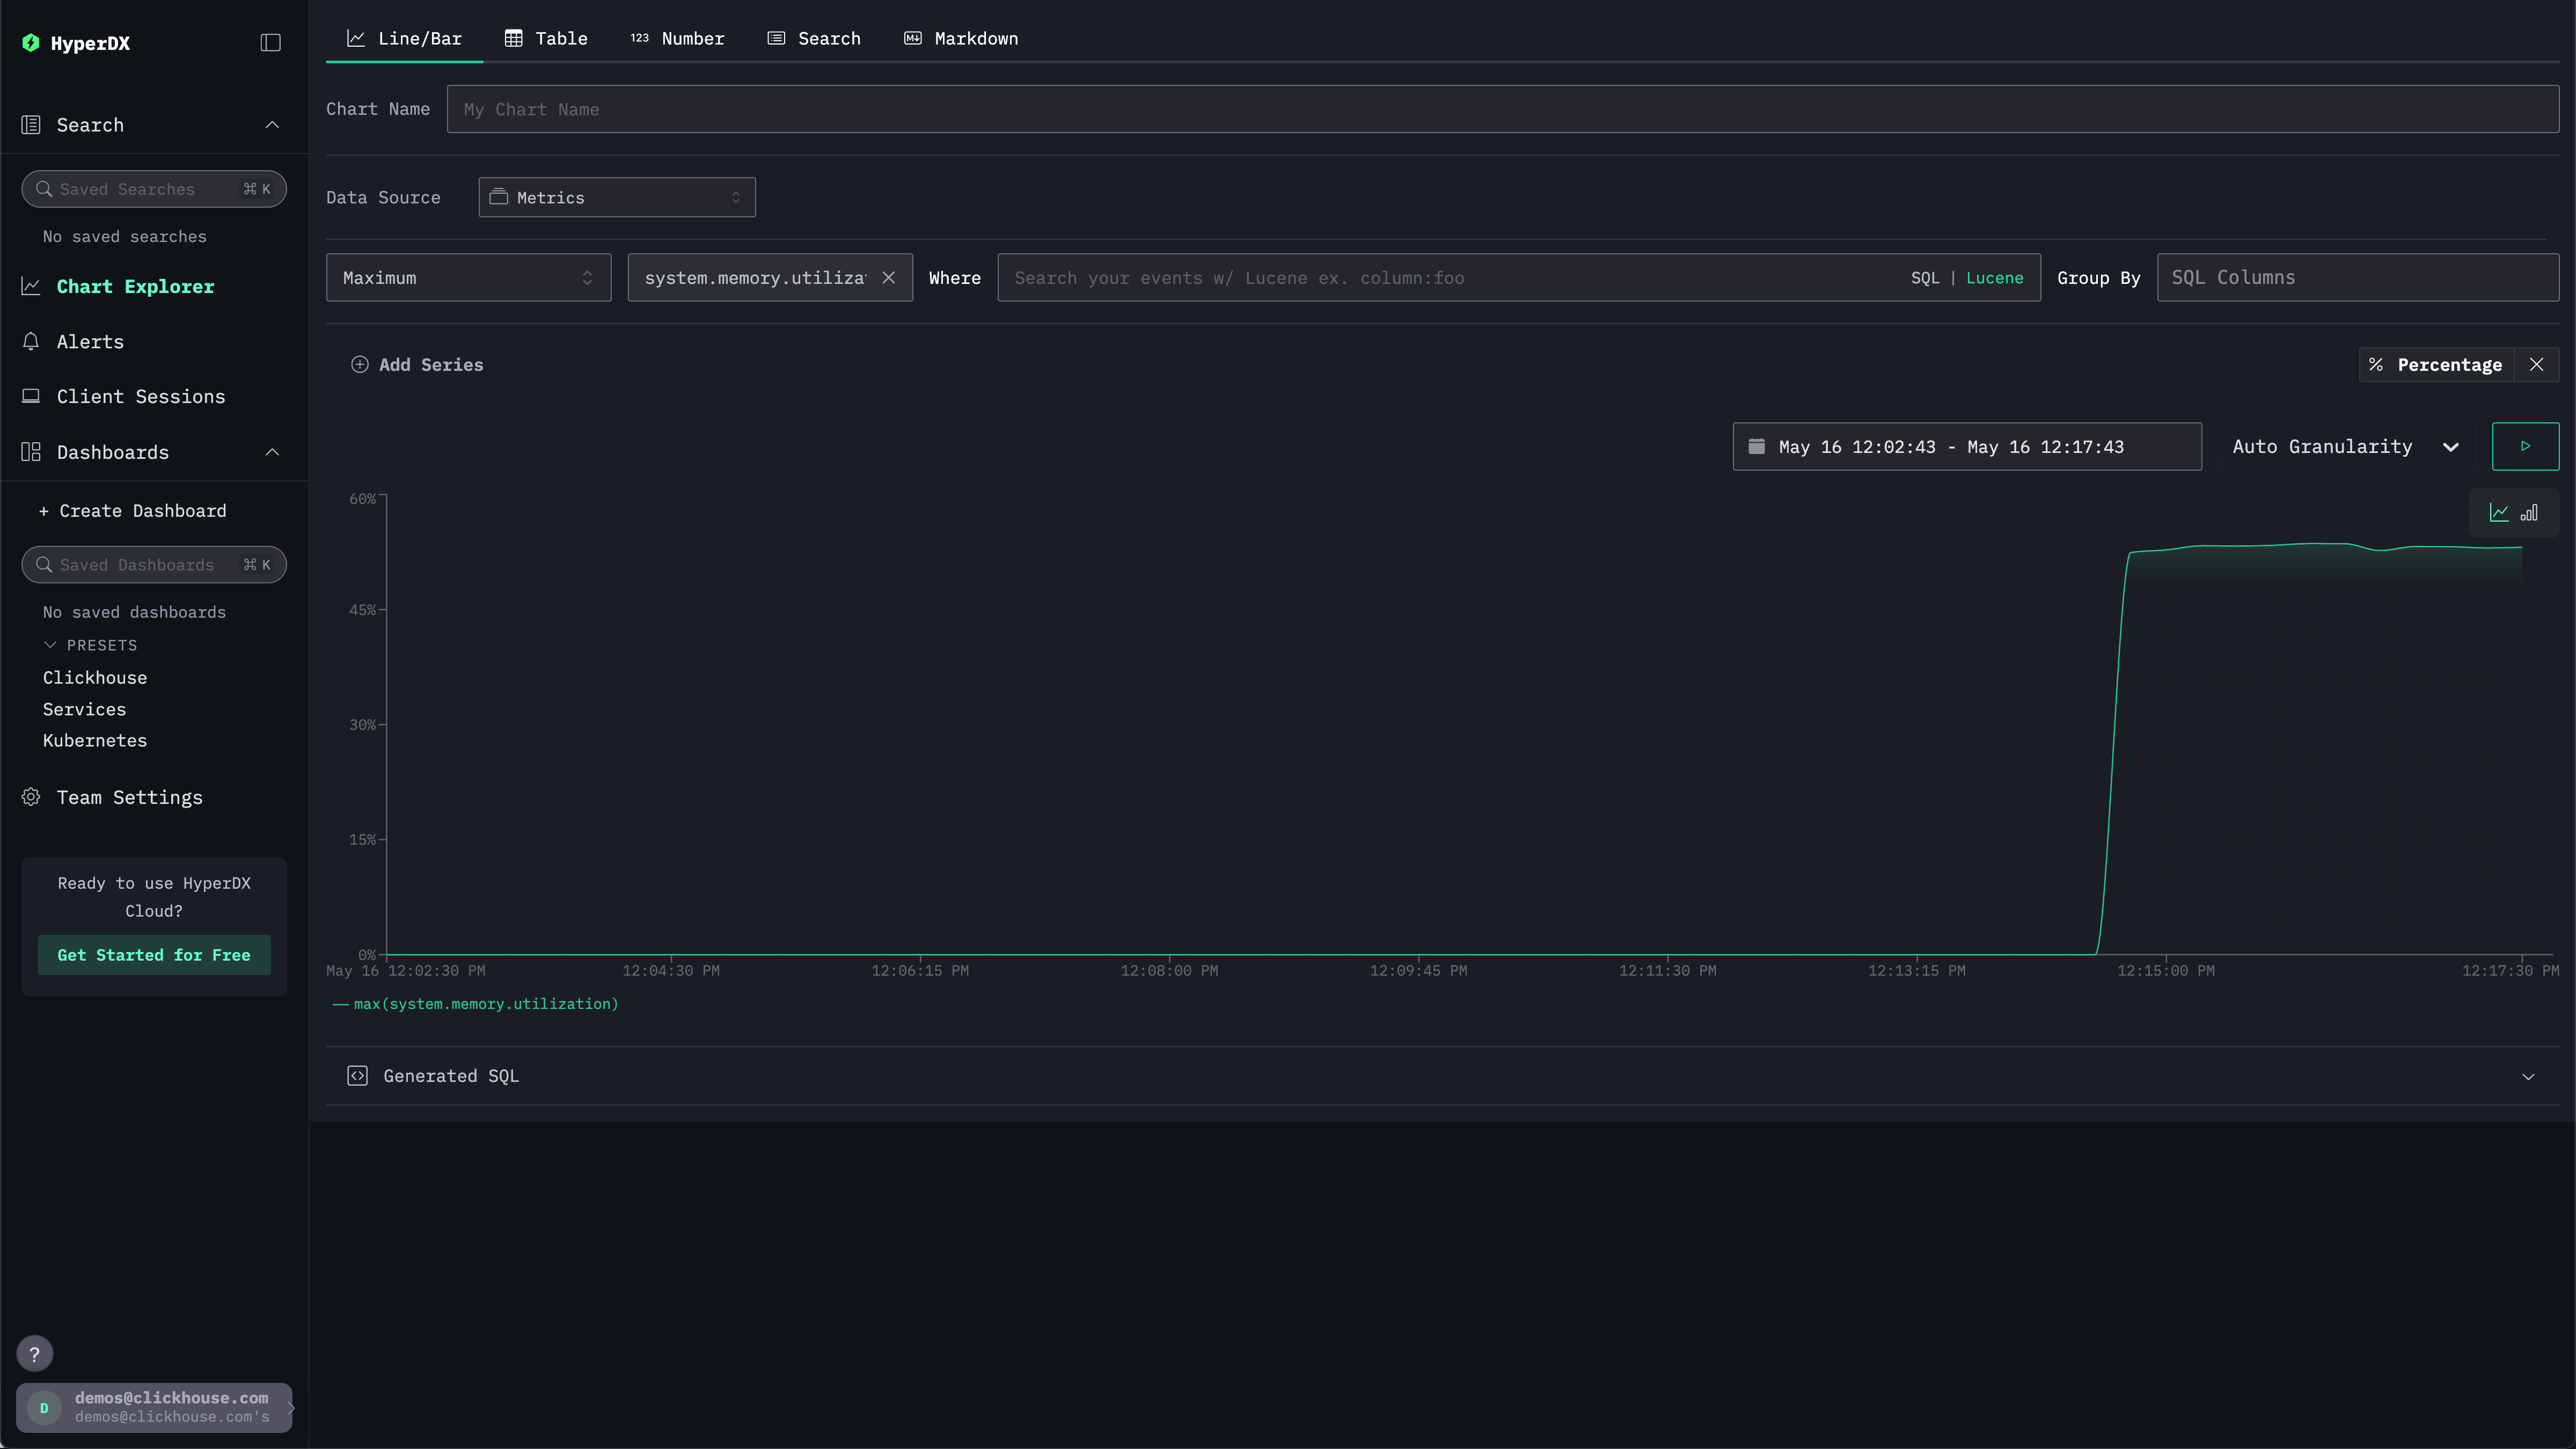
Navigate to the Chart Explorer via the left menu. Select the source Metrics and Maximum as the aggregation type.
For the Select a Metric menu simply type memory before selecting system.memory.utilization (Gauge).
Press the run button to visualize your memory utilization over time.
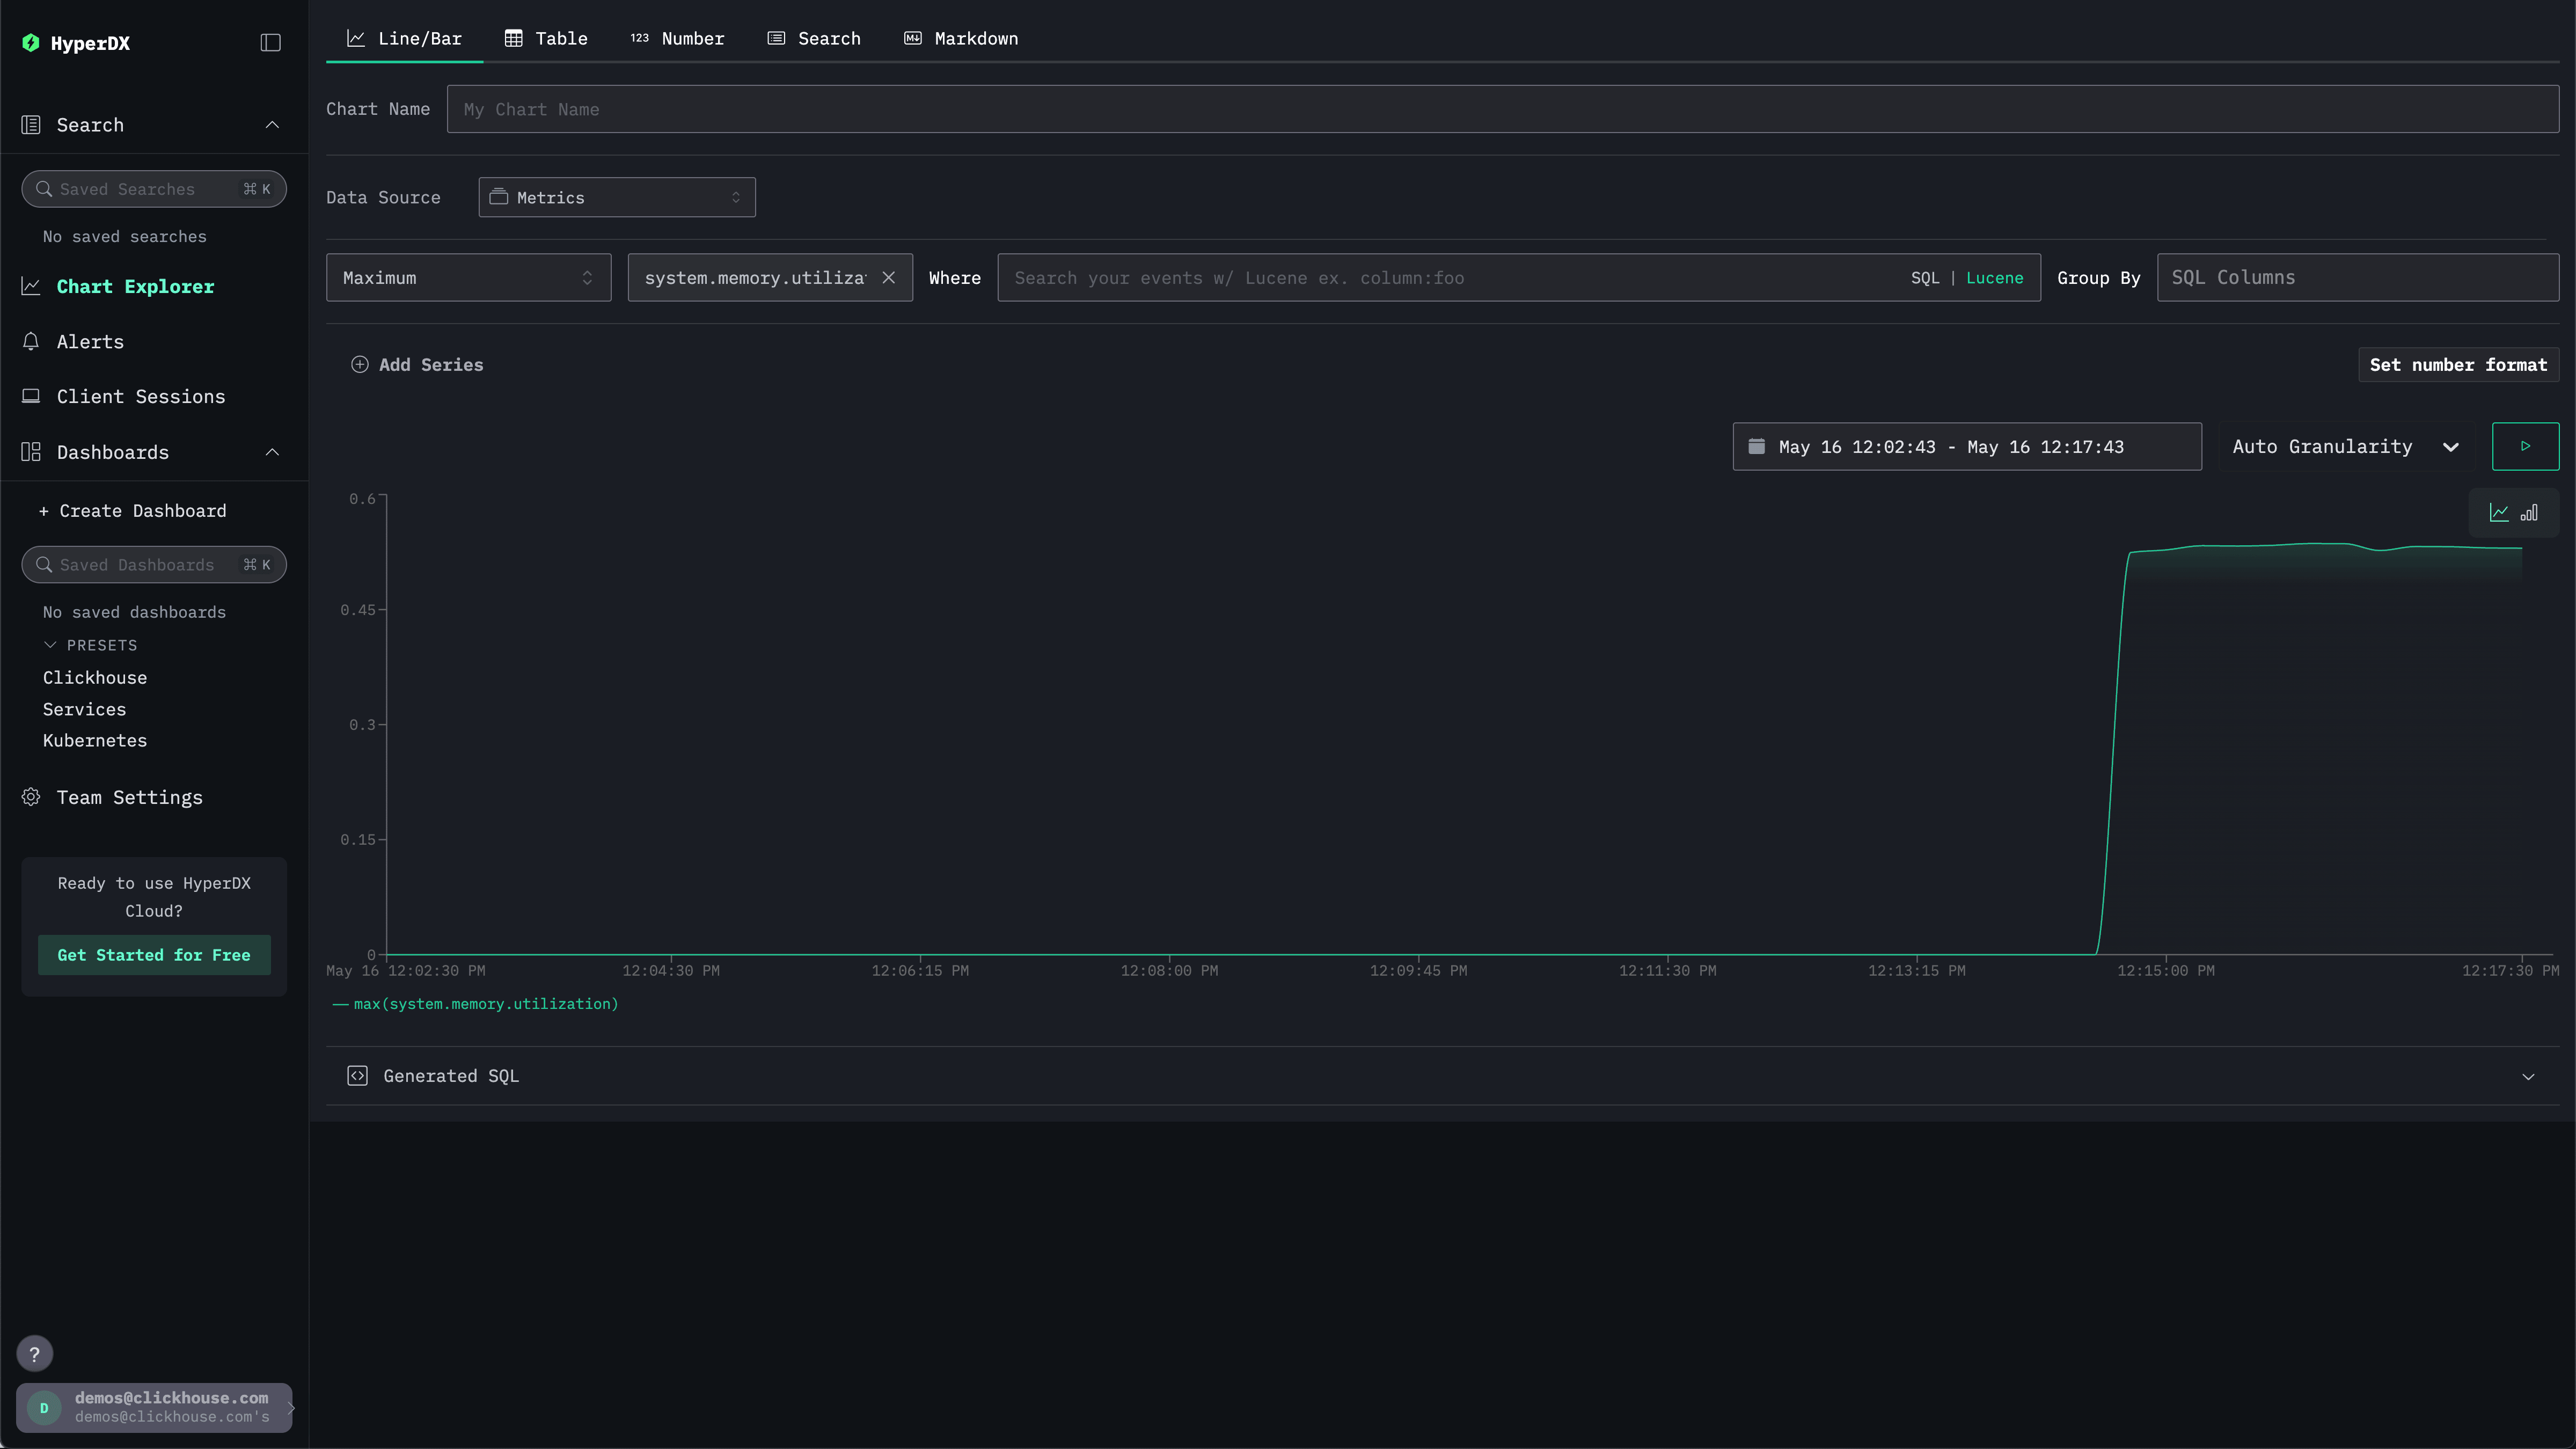
Note the number is returned as a floating point %. To render it more clearly, select Set number format.
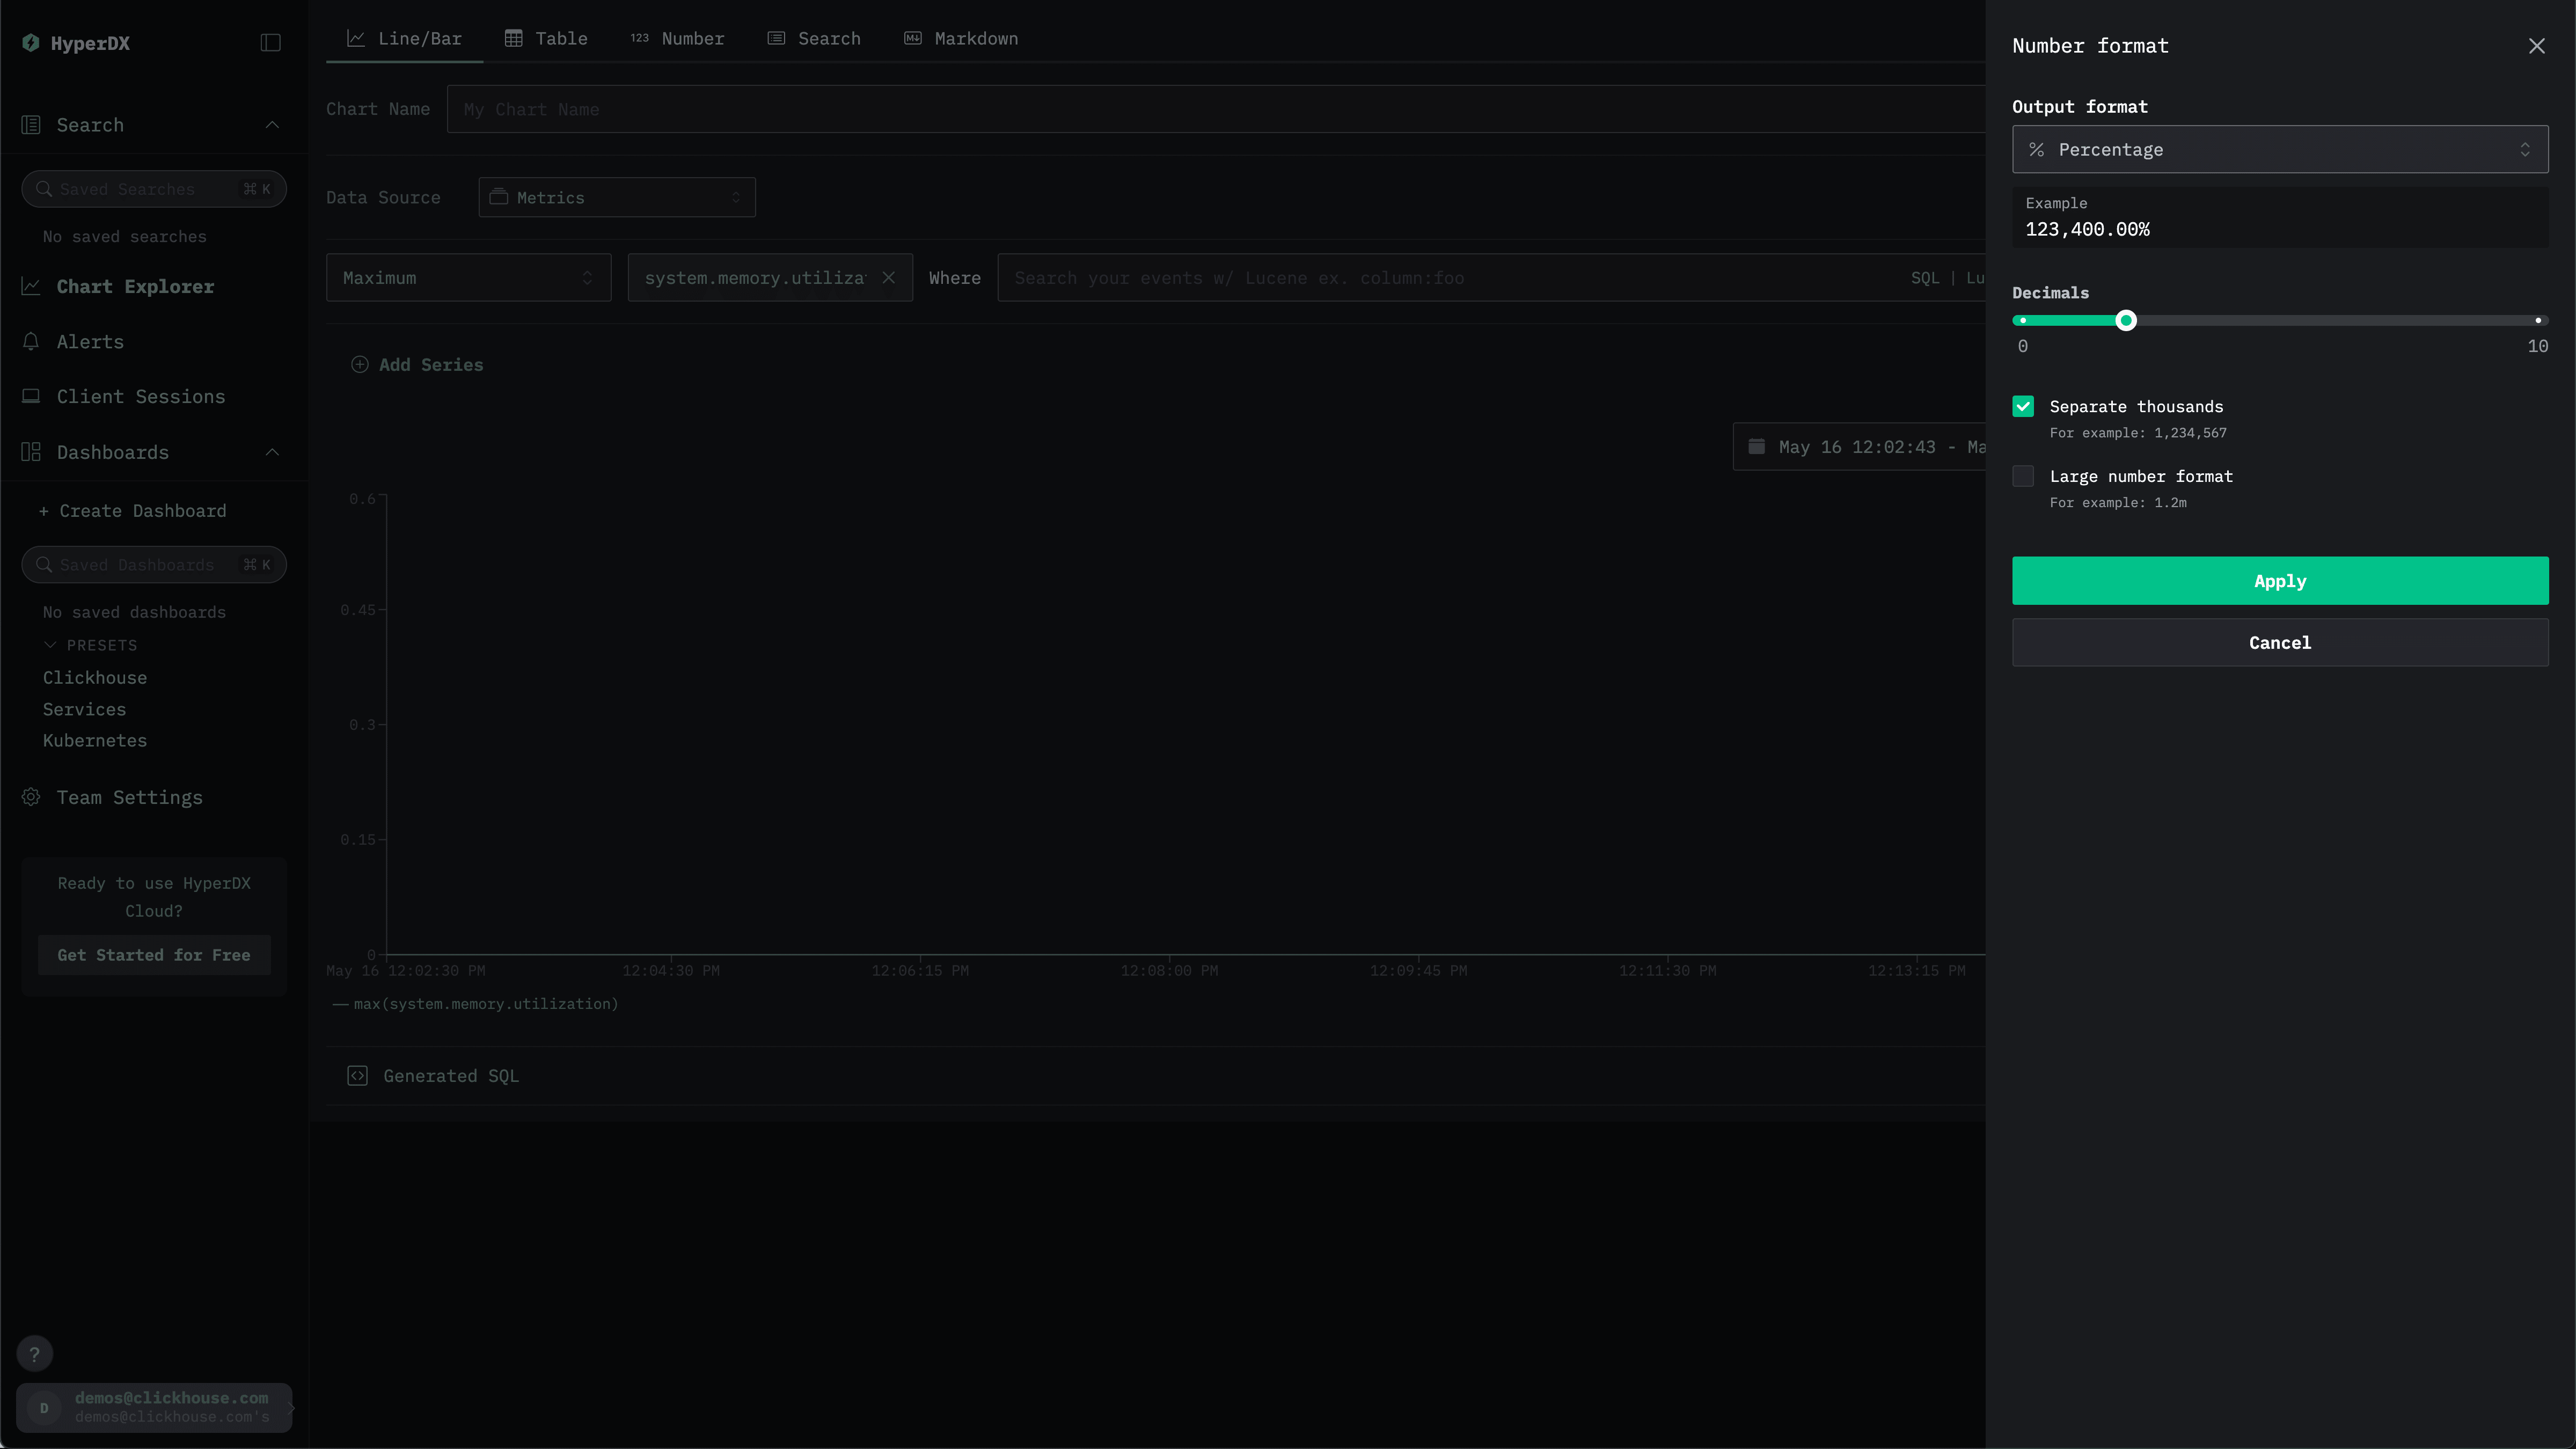
From the subsequent menu you can select Percentage from the Output format drop down before clicking Apply.
Create a custom OpenTelemetry configuration
Create a custom-local-config.yaml file with the following content:
receivers:
  filelog:
    include:
      - /host/var/log/**/*.log        # Linux logs from host
      - /host/var/log/syslog
      - /host/var/log/messages
      - /host/private/var/log/*.log   # macOS logs from host
    start_at: beginning
    resource:
      service.name: "system-logs"

  hostmetrics:
    collection_interval: 1s
    scrapers:
      cpu:
        metrics:
          system.cpu.time:
            enabled: true
          system.cpu.utilization:
            enabled: true
      memory:
        metrics:
          system.memory.usage:
            enabled: true
          system.memory.utilization:
            enabled: true
      filesystem:
        metrics:
          system.filesystem.usage:
            enabled: true
          system.filesystem.utilization:
            enabled: true
      paging:
        metrics:
          system.paging.usage:
            enabled: true
          system.paging.utilization:
            enabled: true
          system.paging.faults:
            enabled: true
      disk:
      load:
      network:
      processes:

service:
  pipelines:
    logs/local:
      receivers: [filelog]
      processors:
        - memory_limiter
        - batch
      exporters:
        - clickhouse
    metrics/hostmetrics:
      receivers: [hostmetrics]
      processors:
        - memory_limiter
        - batch
      exporters:
        - clickhouse
This configuration collects system logs and metrics for OSX and Linux systems, sending the results to ClickStack. The configuration extends the ClickStack collector by adding new receivers and pipelines—you reference the existing clickhouse exporter and processors (memory_limiter, batch) that are already configured in the base ClickStack collector.
For more details on the OpenTelemetry (OTel) configuration structure, we recommend the official guide.
Start ClickStack with custom configuration
Run the following docker command to start the all-in-one container with your custom configuration:
docker run -d --name clickstack \
  -p 8080:8080 -p 4317:4317 -p 4318:4318 \
  --user 0:0 \
  -e CUSTOM_OTELCOL_CONFIG_FILE=/etc/otelcol-contrib/custom.config.yaml \
  -v "$(pwd)/custom-local-config.yaml:/etc/otelcol-contrib/custom.config.yaml:ro" \
  -v /var/log:/host/var/log:ro \
  -v /private/var/log:/host/private/var/log:ro \
clickhouse/clickstack-all-in-one:latestExplore system logs
Visit http://localhost:8080 to access the ClickStack UI if deploying locally.
Data sources should be pre-created for you. The search UI should be populated with local system logs. Expand the filters to select the system.log:
Explore system metrics
We can explore our metrics using charts.
Navigate to the Chart Explorer via the left menu. Select the source Metrics and Maximum as the aggregation type.
For the Select a Metric menu simply type memory before selecting system.memory.utilization (Gauge).
Press the run button to visualize your memory utilization over time.
Note the number is returned as a floating point %. To render it more clearly, select Set number format.
From the subsequent menu you can select Percentage from the Output format drop down before clicking Apply.