

 Set up docs MCP
Integration with existing EC2 instance
This section covers installing OpenTelemetry Collector on your EC2 instances to collect system logs and send them to ClickStack with automatic EC2 metadata enrichment. This distributed architecture is production-ready and scales to multiple instances.
If you would like to test the EC2 host logs integration before configuring your production instance, you can test with our preconfigured setup and sample data in the “Demo dataset” section.
Prerequisites
- ClickStack instance running (can be on-premises, cloud, or local)
- EC2 instance running (Ubuntu, Amazon Linux, or other Linux distribution)
- Network connectivity from EC2 instance to ClickStack’s OTLP endpoint (port 4318 for HTTP or 4317 for gRPC)
- EC2 instance metadata service accessible (enabled by default)
Verify EC2 metadata is accessible
From your EC2 instance, verify the metadata service is accessible:
# Get metadata token (IMDSv2)
TOKEN=$(curl -X PUT "http://169.254.169.254/latest/api/token" -H "X-aws-ec2-metadata-token-ttl-seconds: 21600")

# Verify instance metadata
curl -H "X-aws-ec2-metadata-token: $TOKEN" http://169.254.169.254/latest/meta-data/instance-id
curl -H "X-aws-ec2-metadata-token: $TOKEN" http://169.254.169.254/latest/meta-data/placement/region
curl -H "X-aws-ec2-metadata-token: $TOKEN" http://169.254.169.254/latest/meta-data/instance-type
You should see your instance ID, region, and instance type. If these commands fail, verify:
- The instance metadata service is enabled
- IMDSv2 isn’t blocked by security groups or network ACLs
- You’re running these commands from the EC2 instance itself
Verify syslog files exist
Verify that your EC2 instance is writing syslog files:
# Ubuntu instances
ls -la /var/log/syslog

# Amazon Linux / RHEL instances
ls -la /var/log/messages

# View recent entries
tail -20 /var/log/syslog
# or
tail -20 /var/log/messages
Install OpenTelemetry Collector
Install the OpenTelemetry Collector Contrib distribution on your EC2 instance:
# Download the latest release
wget https://github.com/open-telemetry/opentelemetry-collector-releases/releases/download/v0.114.0/otelcol-contrib_0.114.0_linux_amd64.tar.gz

# Extract and install
tar -xvf otelcol-contrib_0.114.0_linux_amd64.tar.gz
sudo mv otelcol-contrib /usr/local/bin/

# Verify installation
otelcol-contrib --version
Create collector configuration
Create a configuration file for the OpenTelemetry Collector at /etc/otelcol-contrib/config.yaml:
sudo mkdir -p /etc/otelcol-contribChoose the configuration based on your Linux distribution:
sudo tee /etc/otelcol-contrib/config.yaml > /dev/null << 'EOF'
receivers:
  filelog/syslog:
    include:
      - /var/log/syslog
      - /var/log/**/*.log
    start_at: end
    operators:
      - type: regex_parser
        regex: '^(?P<timestamp>\S+) (?P<hostname>\S+) (?P<unit>\S+?)(?:\[(?P<pid>\d+)\])?: (?P<message>.*)$'
        parse_from: body
        parse_to: attributes

      - type: time_parser
        parse_from: attributes.timestamp
        layout_type: gotime
        layout: '2006-01-02T15:04:05.999999-07:00'

      - type: add
        field: attributes.source
        value: "ec2-host-logs"

processors:
  resourcedetection:
    detectors: [ec2, system]
    timeout: 5s
    override: false
    ec2:
      tags:
        - ^Name
        - ^Environment
        - ^Team

  batch:
    timeout: 10s
    send_batch_size: 10000

exporters:
  otlphttp:
    endpoint: "http://YOUR_CLICKSTACK_HOST:4318"
    headers:
      authorization: "${env:CLICKSTACK_API_KEY}"

service:
  pipelines:
    logs:
      receivers: [filelog/syslog]
      processors: [resourcedetection, batch]
      exporters: [otlphttp]
EOF
sudo tee /etc/otelcol-contrib/config.yaml > /dev/null << 'EOF'
receivers:
filelog/syslog:
include:
- /var/log/messages
- /var/log/**/*.log
start_at: end
operators:
- type: regex_parser
regex: '^(?P<timestamp>\w+ \d+ \d{2}:\d{2}:\d{2}) (?P<hostname>\S+) (?P<unit>\S+?)(?:\[(?P<pid>\d+)\])?: (?P<message>.*)$'
parse_from: body
parse_to: attributes
- type: time_parser
parse_from: attributes.timestamp
layout: '%b %d %H:%M:%S'
- type: add
field: attributes.source
value: "ec2-host-logs"
processors:
resourcedetection:
detectors: [ec2, system]
timeout: 5s
override: false
ec2:
tags:
- ^Name
- ^Environment
- ^Team
batch:
timeout: 10s
send_batch_size: 10000
exporters:
otlphttp:
endpoint: "http://YOUR_CLICKSTACK_HOST:4318"
headers:
authorization: "${env:CLICKSTACK_API_KEY}"
service:
pipelines:
logs:
receivers: [filelog/syslog]
processors: [resourcedetection, batch]
exporters: [otlphttp]
EOFReplace the following in the configuration:
YOUR_CLICKSTACK_HOST: The hostname or IP address where ClickStack is running- For local testing, you can use an SSH tunnel (see the Troubleshooting section)
This configuration:
- Reads system log files from standard locations (
/var/log/syslogfor Ubuntu,/var/log/messagesfor Amazon Linux/RHEL) - Parses syslog format to extract structured fields (timestamp, hostname, unit/service, PID, message)
- Automatically detects and adds EC2 metadata using the
resourcedetectionprocessor - Optionally includes EC2 tags (Name, Environment, Team) if present
- Sends logs to ClickStack via OTLP HTTP
Set ClickStack API key
Export your ClickStack API key as an environment variable:
export CLICKSTACK_API_KEY="your-api-key-here"To make this persistent across reboots, add it to your shell profile:
echo 'export CLICKSTACK_API_KEY="your-api-key-here"' >> ~/.bashrc
source ~/.bashrc
Run the collector
Start the OpenTelemetry Collector:
CLICKSTACK_API_KEY="your-api-key-here" /usr/local/bin/otelcol-contrib --config /etc/otelcol-contrib/config.yamlVerifying Logs in HyperDX
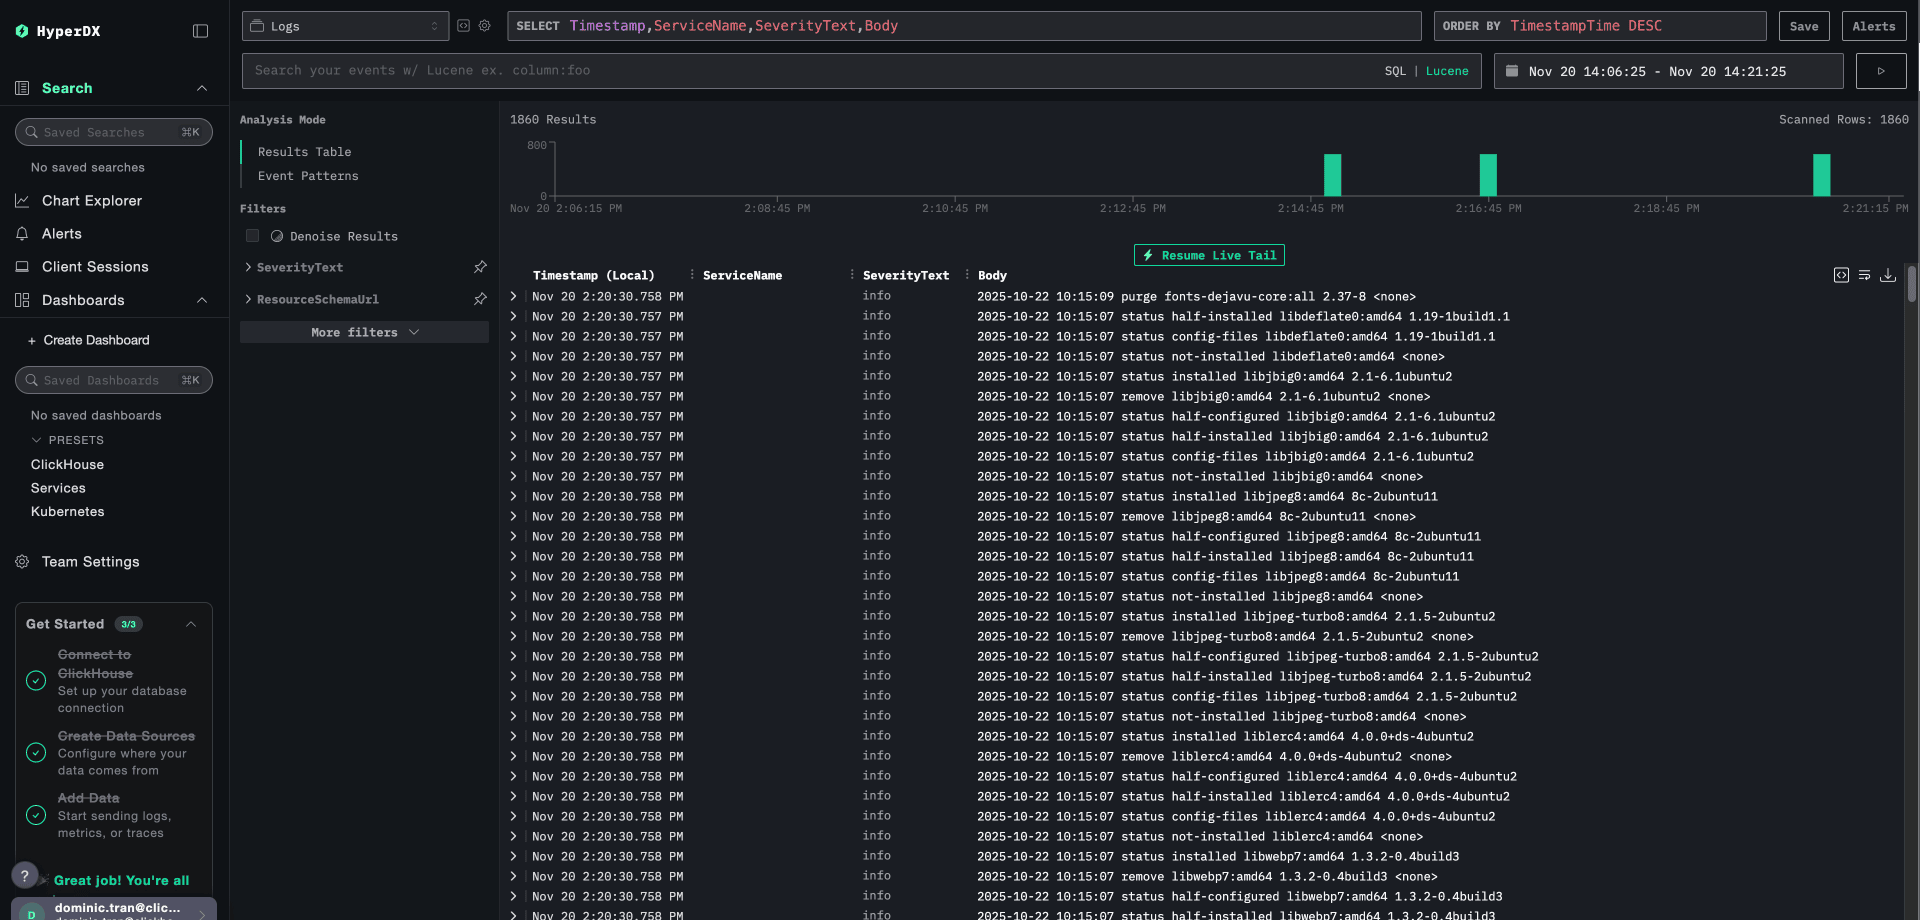
Once the collector is running, log into HyperDX and verify logs are flowing with EC2 metadata:
- Navigate to the search view
- Set source to
Logs - Filter by
source:ec2-host-logs - Click on a log entry to expand it
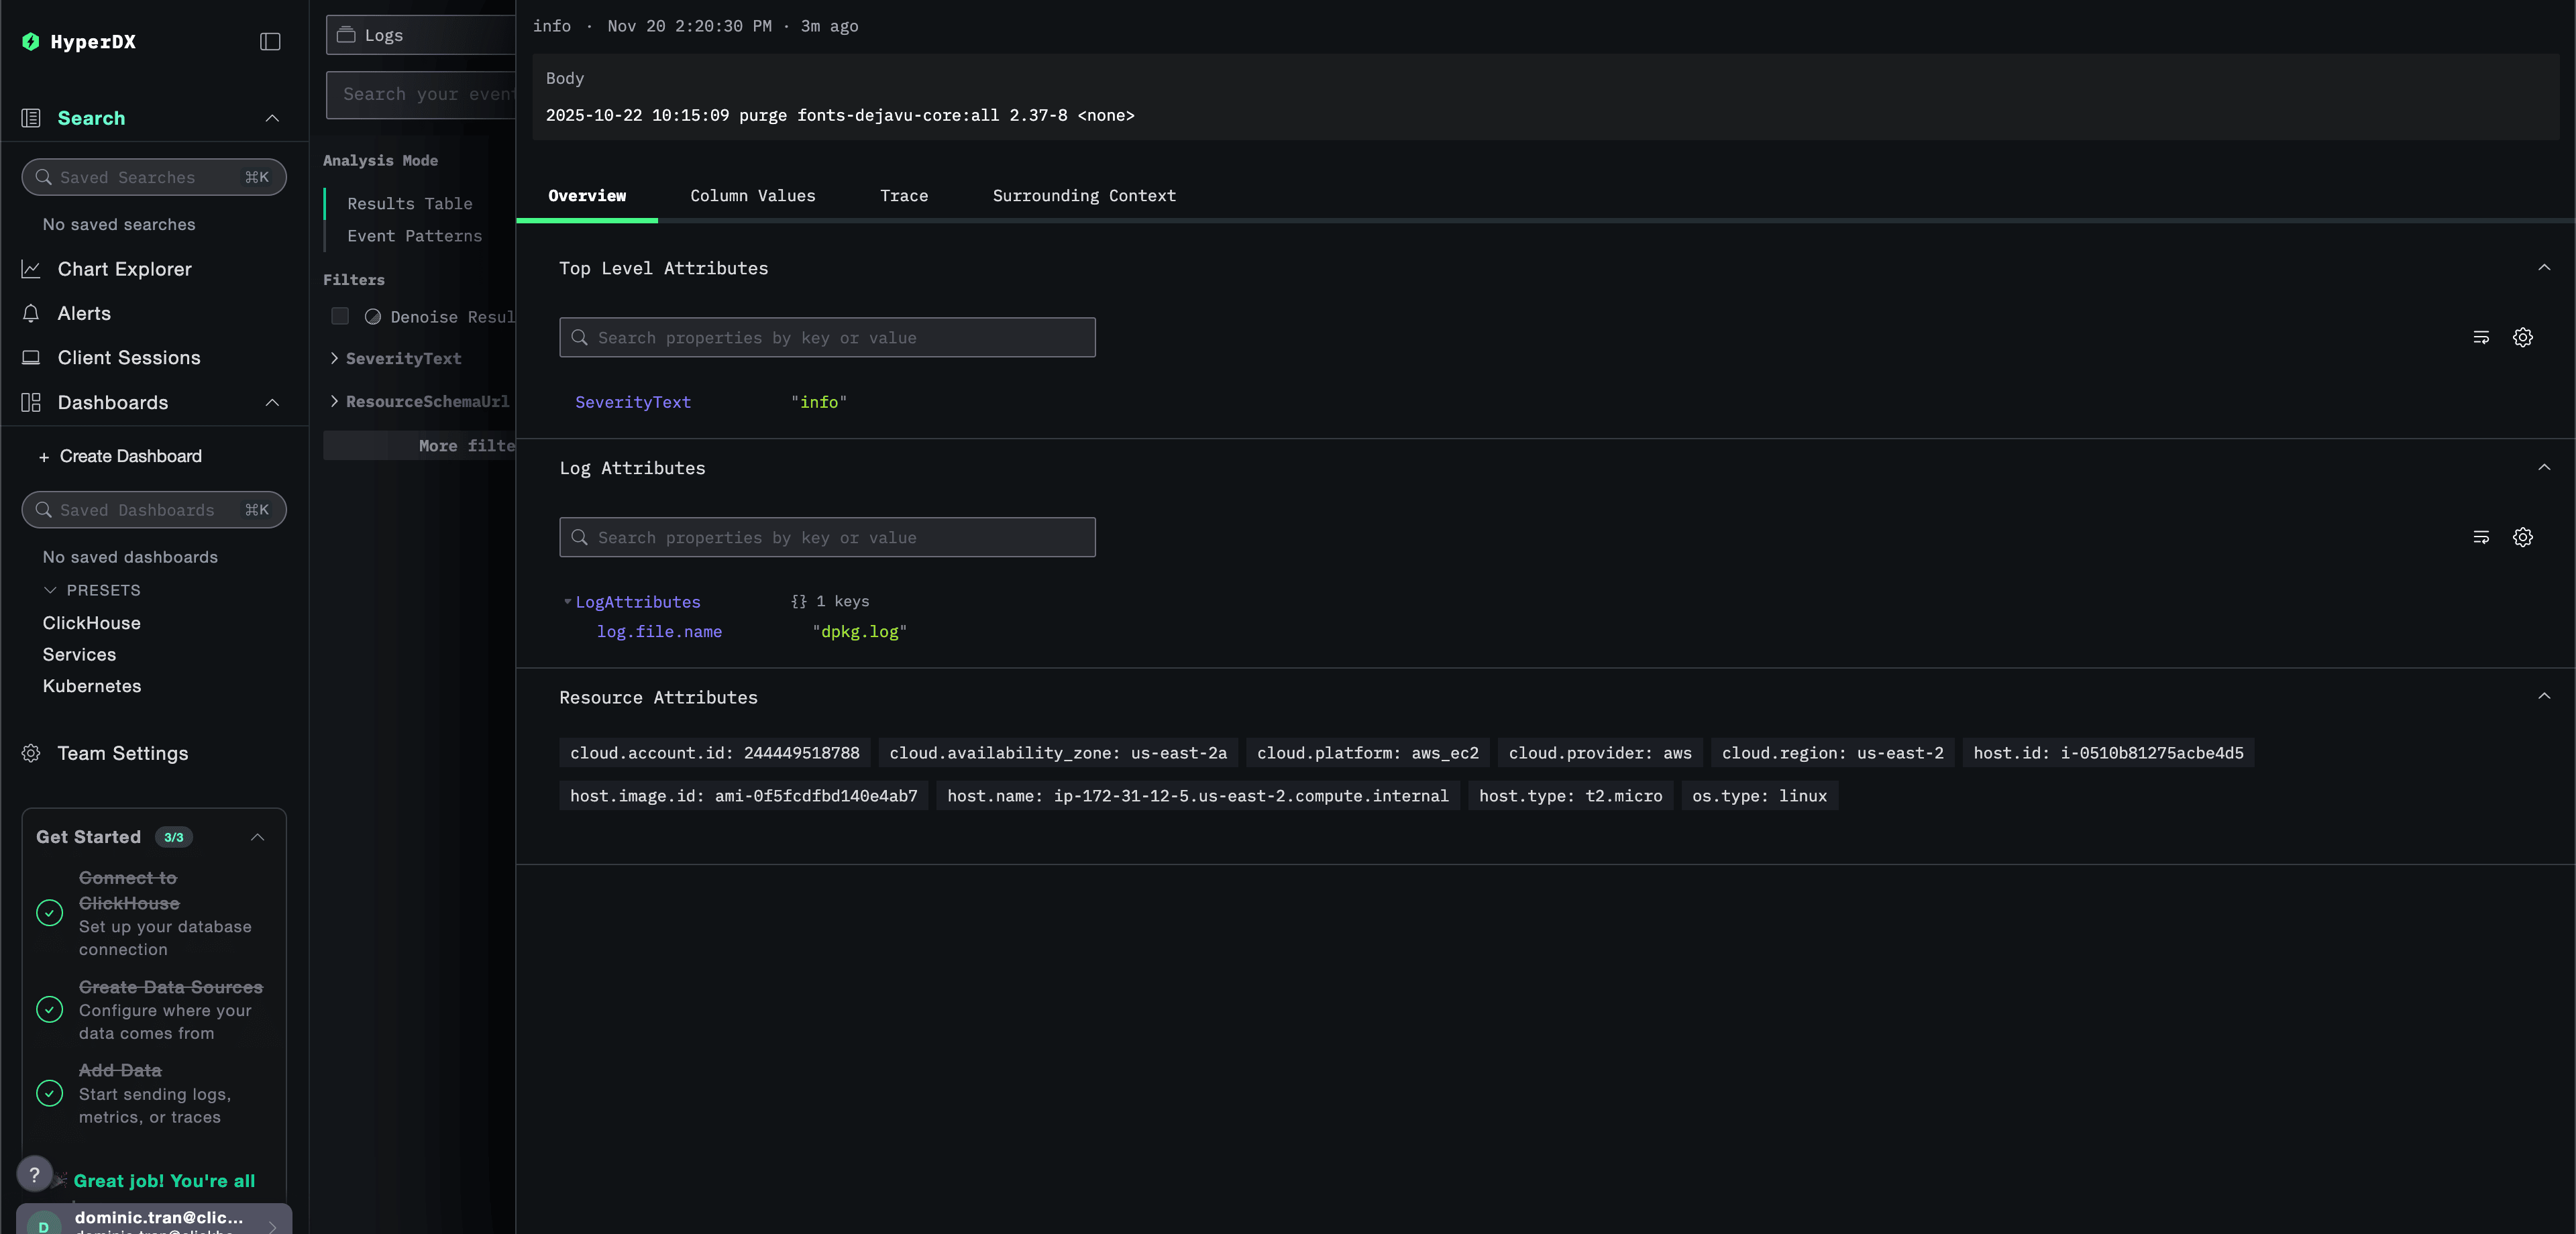
- Verify you see EC2 metadata in the resource attributes:
cloud.providercloud.regionhost.id(instance ID)host.type(instance type)cloud.availability_zone
Demo dataset
For users who want to test the EC2 host logs integration before configuring their production instances, we provide a sample dataset with simulated EC2 metadata.
Download the sample dataset
Download the sample log file:
curl -O https://datasets-documentation.s3.eu-west-3.amazonaws.com/clickstack-integrations/host-logs/journal.logThe dataset includes:
- System boot sequence
- SSH login activity (successful and failed attempts)
- Security incident (brute force attack with fail2ban response)
- Scheduled maintenance (cron jobs, anacron)
- Service restarts (rsyslog)
- Kernel messages and firewall activity
- Mix of normal operations and notable events
Create test collector configuration
Create a file named ec2-host-logs-demo.yaml with the following configuration:
cat > ec2-host-logs-demo.yaml << 'EOF'
receivers:
  filelog/journal:
    include:
      - /tmp/host-demo/journal.log
    start_at: beginning
    operators:
      - type: regex_parser
        regex: '^(?P<timestamp>\S+) (?P<hostname>\S+) (?P<unit>\S+?)(?:\[(?P<pid>\d+)\])?: (?P<message>.*)$'
        parse_from: body
        parse_to: attributes

      - type: time_parser
        parse_from: attributes.timestamp
        layout: '%Y-%m-%dT%H:%M:%S%z'

      - type: add
        field: attributes.source
        value: "ec2-demo"

processors:
  # Simulate EC2 metadata for demo (no real EC2 instance required)
  resource:
    attributes:
      - key: service.name
        value: "ec2-demo"
        action: insert
      - key: cloud.provider
        value: "aws"
        action: insert
      - key: cloud.platform
        value: "aws_ec2"
        action: insert
      - key: cloud.region
        value: "us-east-1"
        action: insert
      - key: cloud.availability_zone
        value: "us-east-1a"
        action: insert
      - key: host.id
        value: "i-0abc123def456789"
        action: insert
      - key: host.type
        value: "t3.medium"
        action: insert
      - key: host.name
        value: "prod-web-01"
        action: insert

service:
  pipelines:
    logs/ec2-demo:
      receivers: [filelog/journal]
      processors:
        - resource
        - memory_limiter
        - transform
        - batch
      exporters:
        - clickhouse
EOFRun ClickStack with demo configuration
Run ClickStack with the demo logs and configuration:
docker run --name clickstack-demo \
  -p 8080:8080 -p 4317:4317 -p 4318:4318 \
  -e CUSTOM_OTELCOL_CONFIG_FILE=/etc/otelcol-contrib/custom.config.yaml \
  -v "$(pwd)/ec2-host-logs-demo.yaml:/etc/otelcol-contrib/custom.config.yaml:ro" \
  -v "$(pwd)/journal.log:/tmp/host-demo/journal.log:ro" \
  docker.hyperdx.io/hyperdx/hyperdx-all-in-one:latest
Verify logs in HyperDX
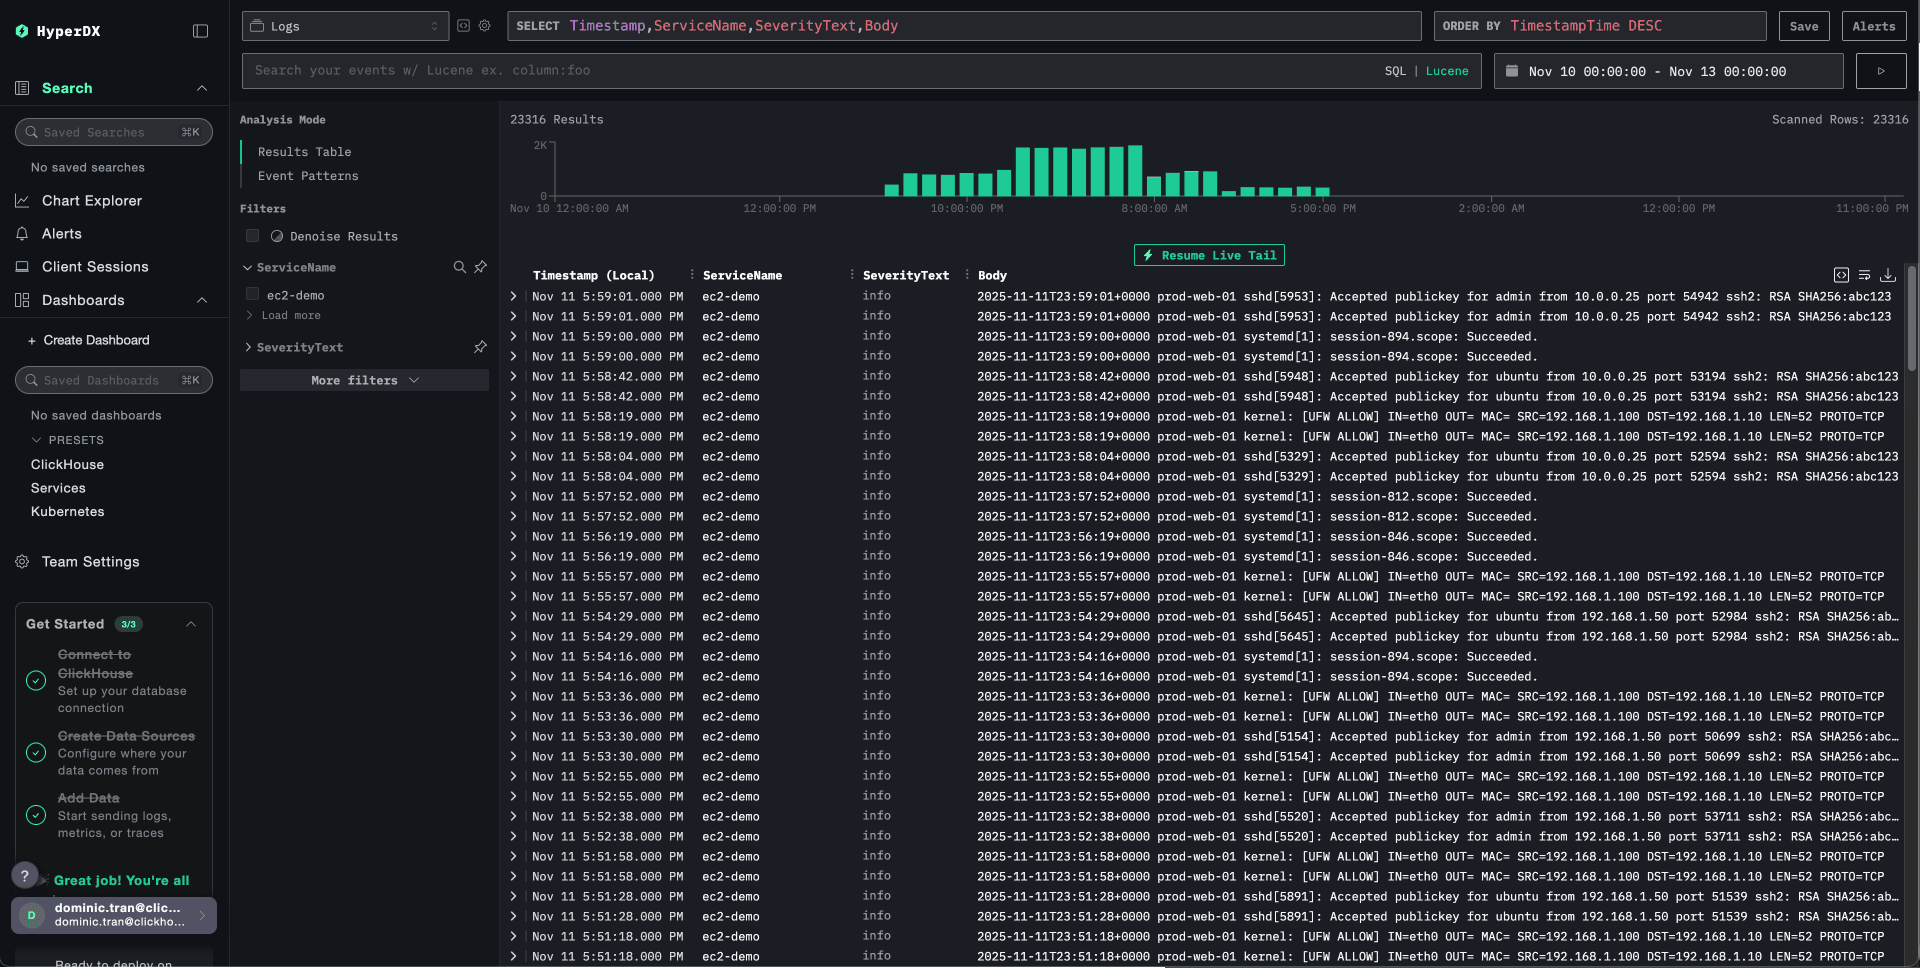
Once the collector is running:
- Open HyperDX and log in to your account (you may need to create an account first)
- Navigate to the search view and set the source to
Logs - Set the time range to 2025-11-10 00:00:00 - 2025-11-13 00:00:00
- Filter by
source:ec2-demo - Expand a log entry to view EC2 metadata in the resource attributes
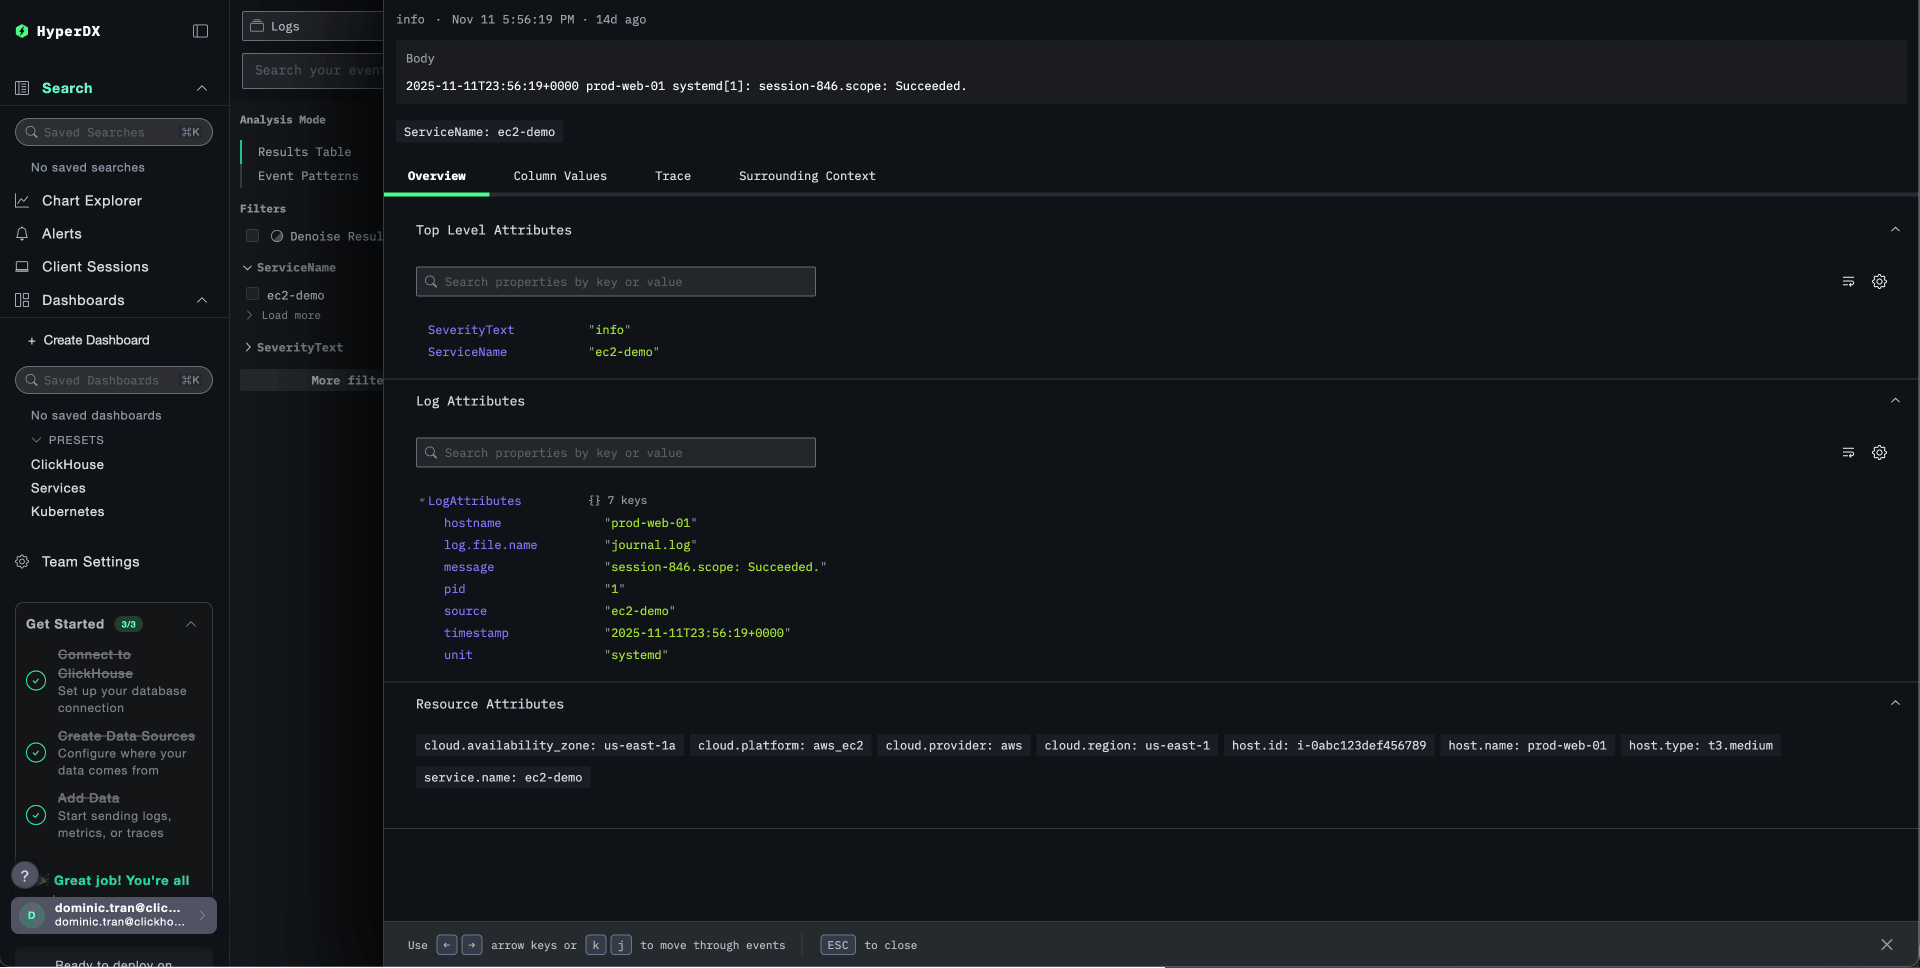
You should see logs with simulated EC2 context including:
- Instance ID:
i-0abc123def456789 - Region:
us-east-1 - Availability Zone:
us-east-1a - Instance Type:
t3.medium
Dashboards and visualization
To help you get started monitoring EC2 host logs with ClickStack, we provide essential visualizations with cloud context.
Download the dashboard configuration
Import the pre-built dashboard
- Open HyperDX and navigate to the Dashboards section
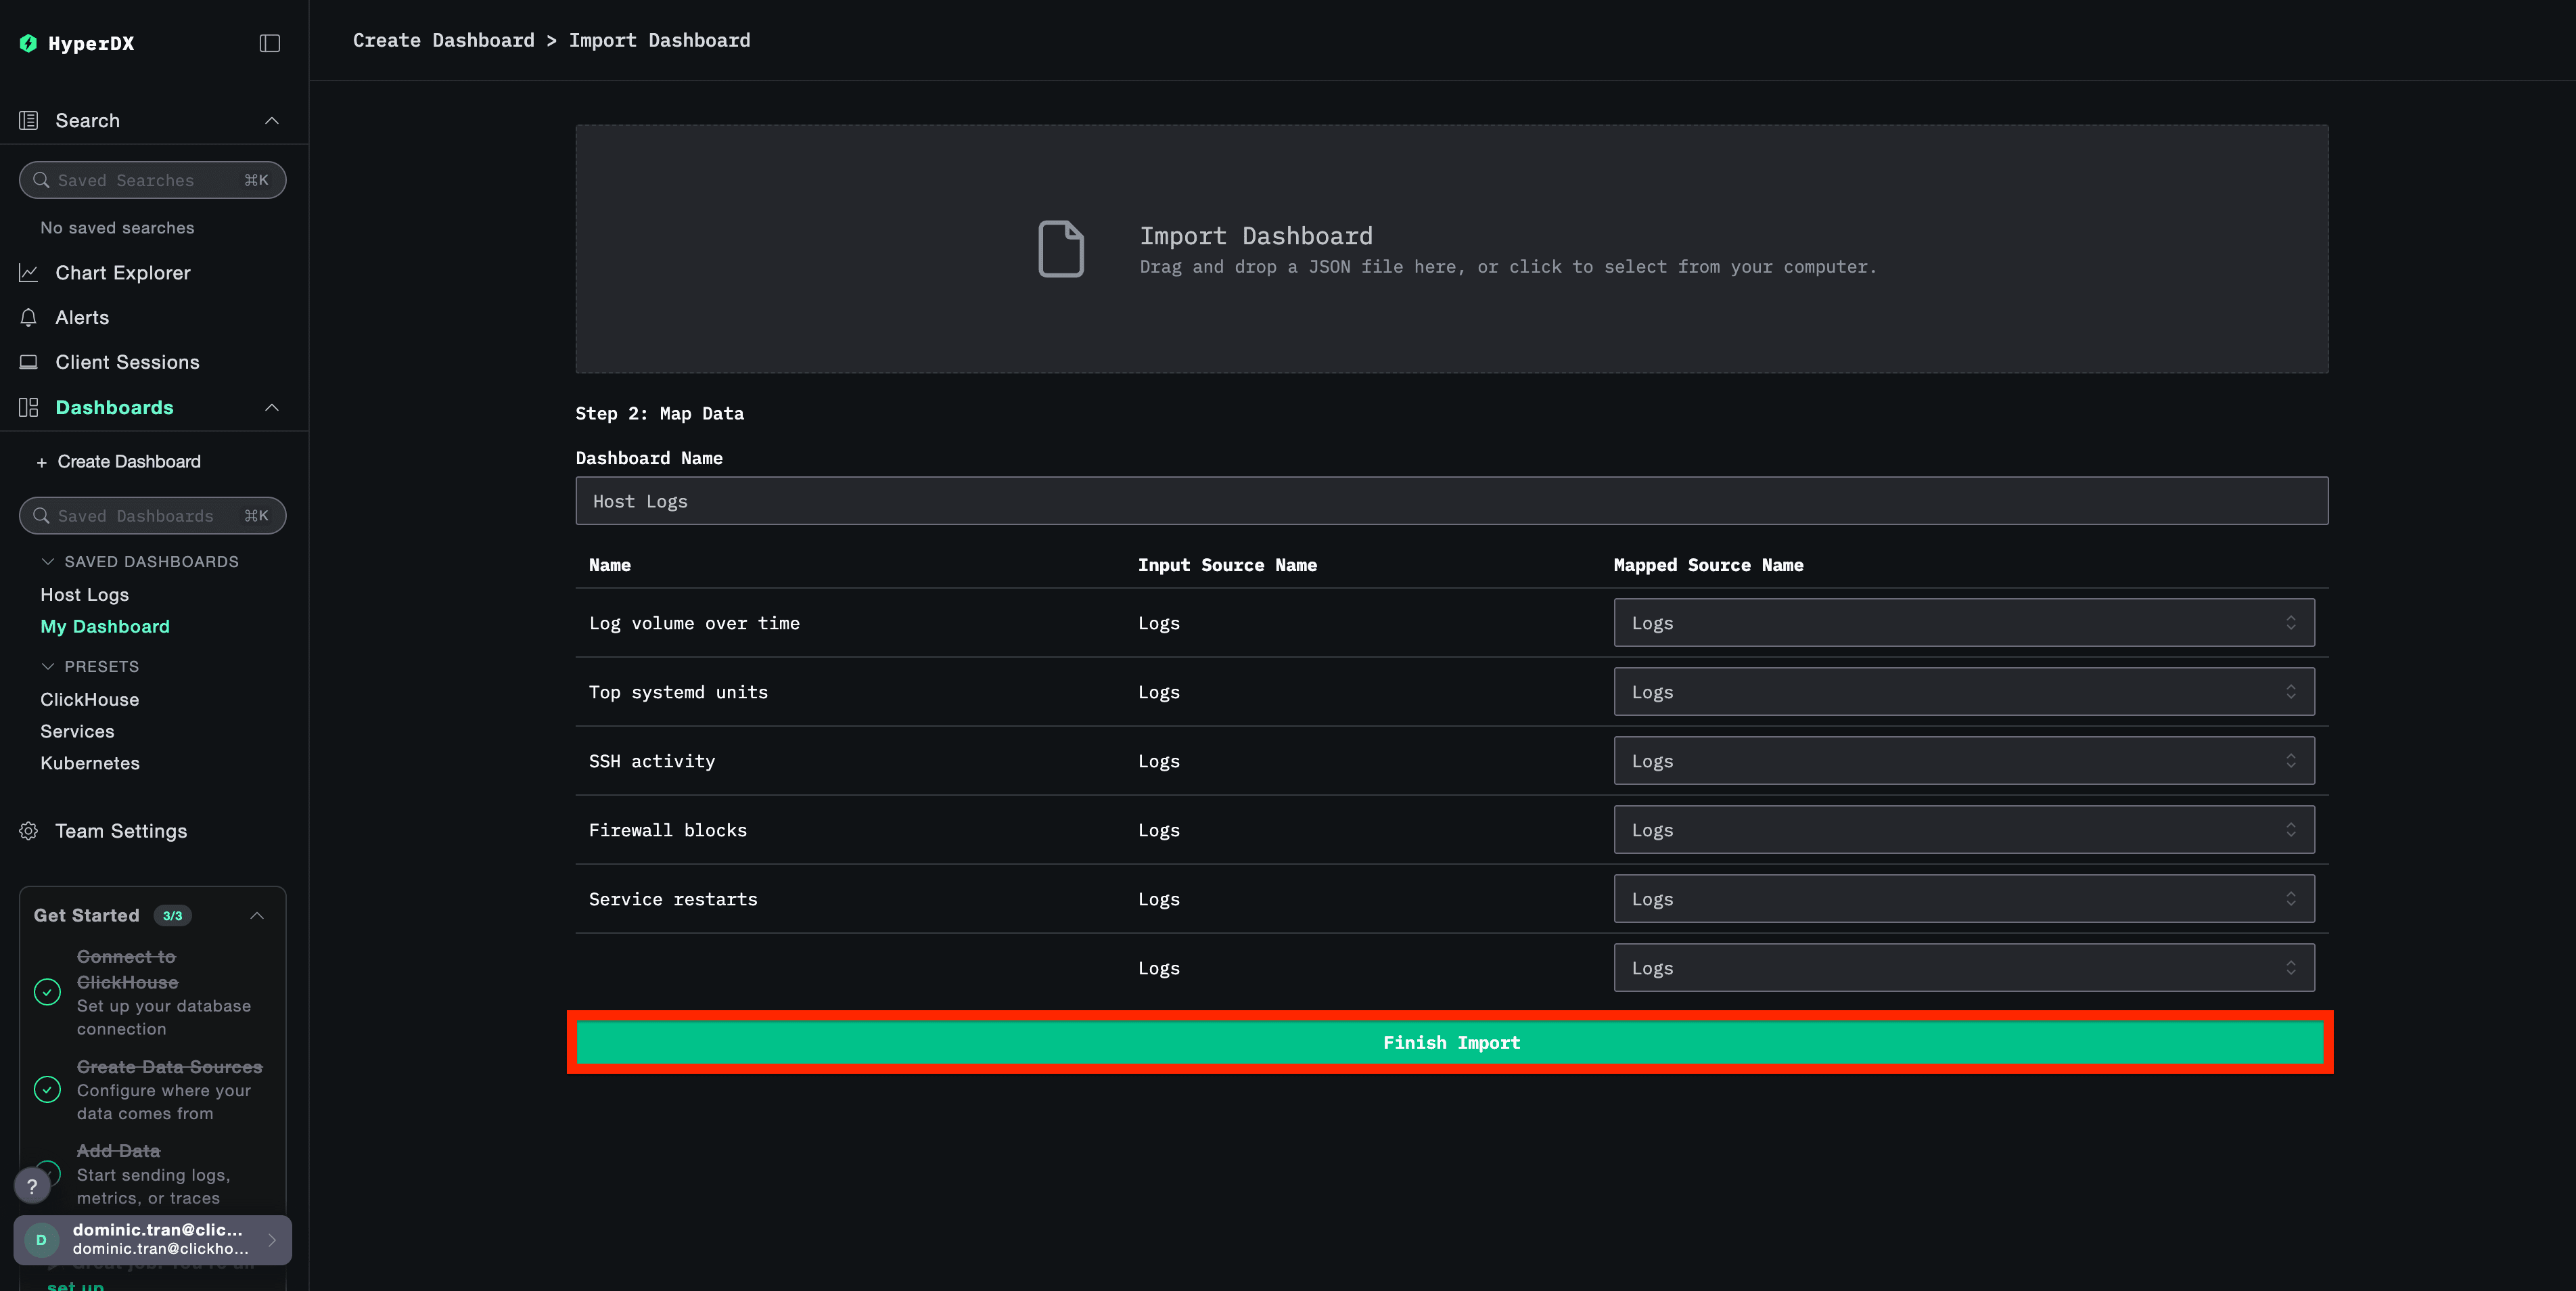
- Click Import Dashboard in the upper right corner under the ellipses

- Upload the
host-logs-dashboard.jsonfile and click Finish Import
View the dashboard
The dashboard will be created with all visualizations pre-configured:
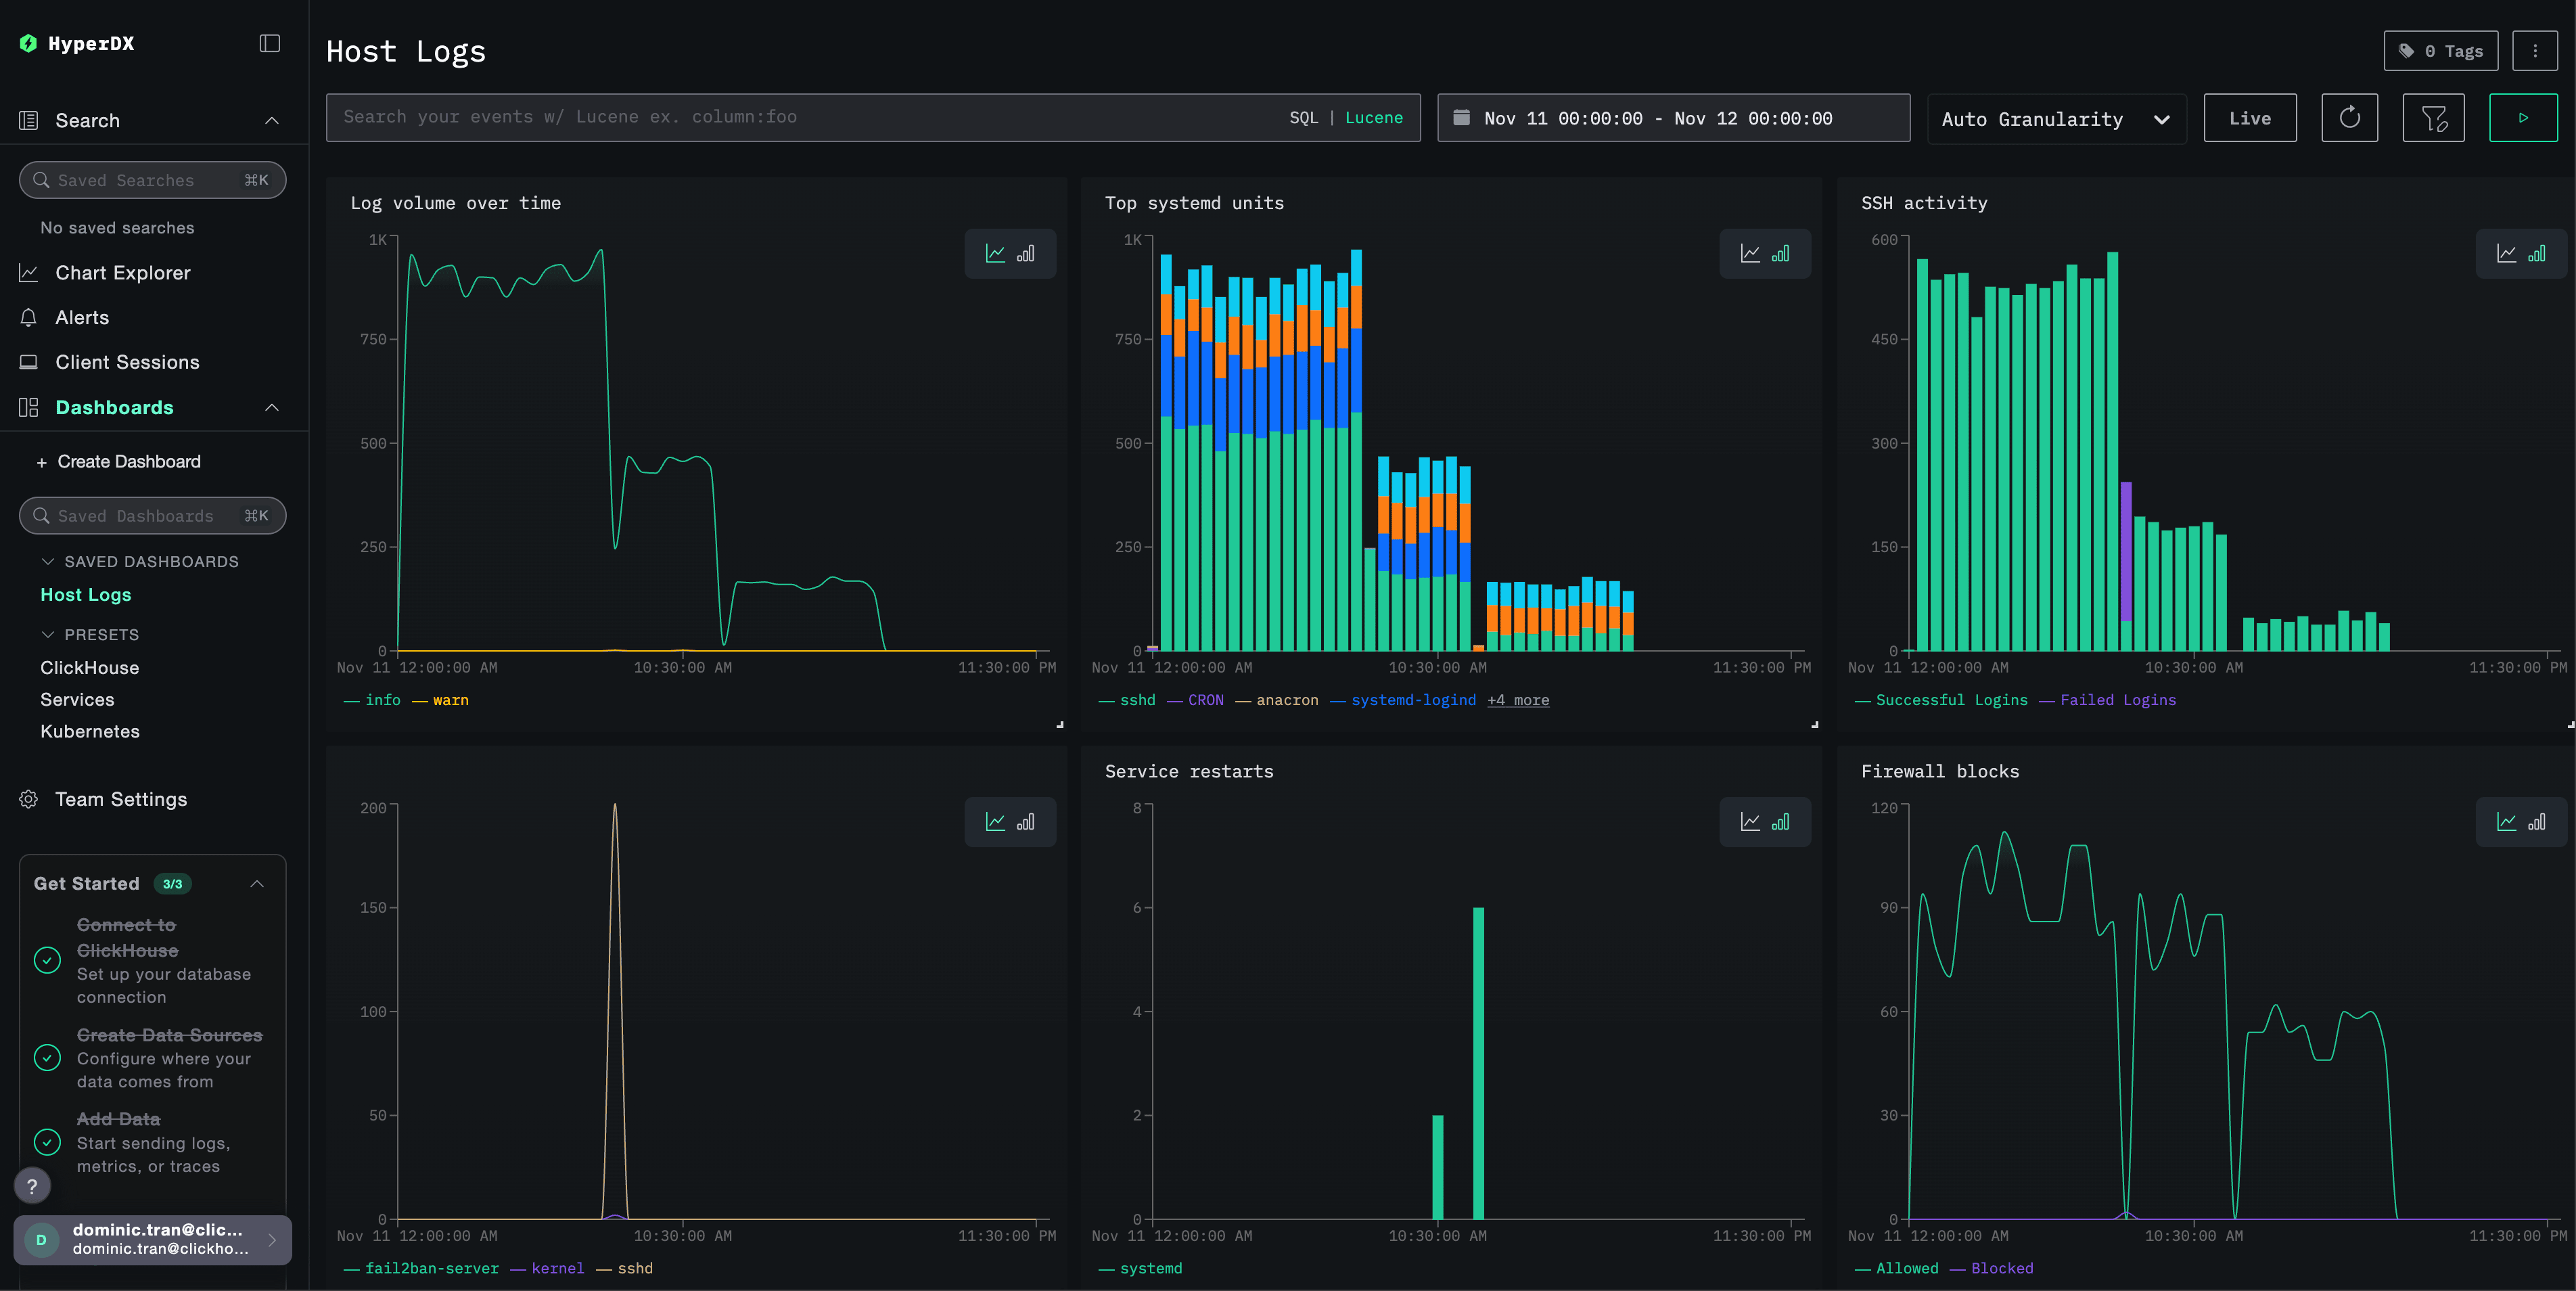
You can filter dashboard visualizations by EC2 context:
cloud.region:us-east-1- Show logs from specific regionhost.type:t3.medium- Filter by instance typehost.id:i-0abc123def456- Logs from specific instance
Troubleshooting
EC2 metadata not appearing in logs
Verify the EC2 metadata service is accessible:
# Get metadata token
TOKEN=$(curl -X PUT "http://169.254.169.254/latest/api/token" -H "X-aws-ec2-metadata-token-ttl-seconds: 21600")

# Test metadata endpoint
curl -H "X-aws-ec2-metadata-token: $TOKEN" http://169.254.169.254/latest/meta-data/instance-id
If this fails, verify:
- The instance metadata service is enabled
- IMDSv2 isn’t blocked by security groups
- You’re running the collector on the EC2 instance itself
Check collector logs for metadata errors:
# If running as systemd service
sudo journalctl -u otelcol-contrib -f | grep -i "ec2\|metadata\|resourcedetection"

# If running in foreground, check stdout
No logs appearing in HyperDX
Verify syslog files exist and are being written:
ls -la /var/log/syslog /var/log/messages
tail -f /var/log/syslog
Check collector can read the log files:
cat /var/log/syslog | head -20Verify network connectivity to ClickStack:
# Test OTLP endpoint
curl -v http://YOUR_CLICKSTACK_HOST:4318/v1/logs

# Should get a response (even if error, means endpoint is reachable)
Check collector logs for errors:
# If running in foreground
# Look for error messages in stdout

# If running as systemd service
sudo journalctl -u otelcol-contrib -f | grep -i "error\|failed"
Logs parsing incorrectly
Verify your syslog format:
For Ubuntu 24.04+:
# Should show ISO8601 format: 2025-11-17T20:55:44.826796+00:00
tail -5 /var/log/syslog
For Amazon Linux 2 / Ubuntu 20.04:
# Should show traditional format: Nov 17 14:16:16
tail -5 /var/log/messages
If your format doesn’t match, use the appropriate configuration tab in the Create collector configuration section based on your distribution.
Collector not starting as systemd service
Check service status:
sudo systemctl status otelcol-contribView detailed logs:
sudo journalctl -u otelcol-contrib -n 50Common issues:
- API key not set correctly in environment
- Config file syntax errors
- Permission issues reading log files
Next steps
- Set up alerts for critical system events (service failures, authentication failures, disk warnings)
- Filter by EC2 metadata attributes (region, instance type, instance ID) to monitor specific resources
- Correlate EC2 host logs with application logs for comprehensive troubleshooting
- Create custom dashboards for security monitoring (SSH attempts, sudo usage, firewall blocks)
Going to production
This guide installs the OpenTelemetry Collector directly on EC2 instances, which is the recommended production pattern for host-level monitoring. For managing collectors across many instances, consider using configuration management tools (Ansible, Chef, Puppet) or the OpenTelemetry Operator in Kubernetes environments. See Sending OpenTelemetry data for production configuration.